
258 results
Graphing resources for Microsoft Excel


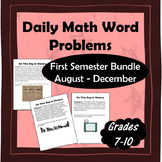

Lucky Charms Cereal Data Analysis and Graphing Project St. Patrick's Day
Looking for a way to review data analysis and graphing skills without it being a bore? This Lucky Charms Cereal Data Analysis and Graphing Project is a fun activity to incorporate in March for St. Patrick's Day, but of course it works at any time of the year in a graphing unit or in a math-integrated unit. Your students will smile when you whip out the box of Lucky Charms and tell them that they are to pretend they are the Quality Control Department at the Cereal Company! This activity is fun an
Subjects:
Grades:
6th - 8th
Types:
NGSS:
MS-ETS1-4

ABA Behavior Graph Excel Workbook
You do not need to purchase multiple licenses; feel free to use with as many clients as you want.Note: Email me at ian.vignes@atlasautismcenter.com for a link to the google sheets version, once you've made your purchase.Description: This file graphs behavior data for a single client. In it's current format, it records frequency and rate of behavior, as well as frequency of function of behavior. In addition, there is a pie chart breakdown of the percentage of each topography of behavior. For an
Grades:
Staff

Ordered Pairs Graphing Coordinate Plane Pixel Art Math | 5 Images | Editable
Ordered pairs mystery pixel art with a doubles / perfect pairs theme! Have students practice finding the location of a coordinate pair on a graph to AUTO-GENERATE one of 5 pixel art images in Google™ Sheets (or Microsoft Excel™) plus a "secret message."★ Low Prep: Just assign the sheet in Google Classroom. Each sheet includes all 5 images; students click the tabs at the bottom to advance to the next pixel image. There are 12 math problems per image to solve.★ Differentiated: Includes 4 versions
Grades:
4th - 5th
Types:

Excel Lessons - Creating Charts
No Prep! These lessons are great as a first Excel Chart lesson or for students already a little familiar with creating charts. Students love the data for these charts because the data is centered around things they love – their cell phones! In Lesson 1, students will create 5 different charts from step-by-step directions which include Chart Titles, Chart Styles, Axis Titles, Data Labels, and Moving Chart to its own Sheet.In Lesson 2, students will create 5 charts from provided data as well as ch
Grades:
5th - 12th
Types:

Spreadsheet - Basics Introduction & Graphing (Excel and Google Sheets)
This lesson guides students via animation and a tutorial video before completing the assignments. This is completely paperless with no prep, and lessons are done on either Microsoft Excel or Google Sheets. Students learn to enter data and start graphing. This resource is intended for learners first starting out or those who need a reminder on using spreadsheets or creating graphs. If you want your students' research papers to include eye-catching graphs, give this lesson a try. Start the slides
Subjects:
Grades:
1st - 8th
Types:

Excel Graphing Template for ABA
Use this Excel template to create a line graph in proper ABA format for behavioral data. An example of a graph is provided in this template. You may graph up to 4 behaviors at a time. To use: 1. Open the Excel file2. Fill in the 4 behaviors you would like to graph at the top (to replace Beh #1, Beh #2, etc)3. Fill in the dates you have data for (this graph is designed to hold 50 days worth of data)4. Fill in your behavioral data in the columns for each behavior5. Watch your graph change as you t
Subjects:
Grades:
Staff

Excel Spreadsheets Million Dollars Activity
This resource allows students to understand the following: How graphs change when spreadsheet data is alteredUse of SUM() functionsHow graphs are madeComponents of a graphAdvantages of spreadsheets over pen and paper methodsStudents use this resource to understand how altering data in spreadsheets allow graphs to change. They understand such concepts by trying to spend a Million Dollars in a minute. Students are then expected to complete the associated worksheet which accompanies the spreadsheet
Grades:
5th - 12th, Adult Education
Types:

Graphing Basic Applied Behavior Analysis Data
This is a great resource for students or teachers that are new to learning how to graph frequency data (e.g., instances of aggression), accuracy data (e.g., % of correct sight words), baseline and treatment data, along with a few more. Each tab contains an example of data that is entered, as well as a (labeled) graph to accompany that data. It is very easy to edit and can be used to graph a multitude of different types of data. It is also a wonderful resource for therapists and other clinicians
Subjects:
Grades:
Not Grade Specific

Computer Graphing for K-2 How Many Puppies?
This beginning graphing activity is a great way to differentiate and meet the needs of all your students as they count and sort four different super cute puppies into groups and record their numbers on tally sheets. Students who may struggle can be given fewer types of pictures to sort and/or count, while more advanced students can be challenged with more to count and sort. Once your students enter their data into a prepared spreadsheet, it will automatically create a pictograph!The preformatt
Grades:
K - 2nd
Types:

Patterns in Addition and Multiplication Printable Test Pack {3rd Grade Unit 3}
Make assessment administration incredibly easy with this printable test pack.What You Get:a printable pre-and post-test for the unit (20 questions, multiple choice)Excel data sheets to show student growth study guides to help students prepare for the post-testa student goals sheets for your class to track their growth from the beginning of the unit to the endA link to a tutorial video on how to use the Excel data sheetThis test is aligned to the Georgia Standards of Excellence Unit 3: Patterns i
Subjects:
Grades:
3rd
Types:
Also included in: 3rd Grade Printable Math Test Bundle

More Graphs Added! Graphing Basic Data For Students: An Excel Workbook
This is a great resource to use for data tracking for all of your students or clients. I have expanded the other Graphic Workbook on my TPT store. This resource is made to easily create graphs for a variety of skills or behaviors. As a result, this excel workbook can be used by teachers, behavior analysts, speech therapists, behavior intervention specialists, really anyone who needs data collection. The graphs can be shared during parent-teacher conferences, IEP meetings, included in student pro
Subjects:
Grades:
Not Grade Specific
Types:

Real World Data for Statistical Analysis and Infographic Project
Give your students access to real world data for your statistical analysis unit or data literacy! Dive into statistics with Microsoft Excel™ or Google Sheets™ and years of data. Learn how to use standard deviation, mean or median to interpret data. Choose the best graphs to display conclusions in an infographic. Works great for science fairs! ✔ Includes an infographic project! (Template, expectations, and rubric). ✔ Everything is fully editable and you and your students can even use the images
Grades:
9th - 12th
Types:
CCSS:

Parabola Transformations - Interactive
A handy guide to help new students learn how each change affects the shape and direction of parabolas. Clear color coding for the various pieces of the formula and instant updates help separate and isolate the concepts for easy, intuitive learning.Enter information using simple dropdown menus and organized blank fields to isolate each piece of the formula!Two tabs:One allows you to enter individual pieces of information to show the resulting formulaOne allows you to enter the formula to show the
Subjects:
Grades:
7th - 12th, Higher Education, Adult Education

Computer Graphing for K & 1st Grade-- Can You Catch the Gingerbread Man?
This high interest activity is the perfect thing for the Technology/Computer Lab teacher or the regular classroom teacher to keep their students' attention during the busy holidays. Your kids will sort and count pictures of gingerbread men and record their data as tally marks and/or written numbers. After they finish sorting and counting, they will enter their data into a prepared spreadsheet and generate a super cute pictograph. This activity can be done individually or as a whole group if p
Grades:
K - 2nd
Types:

Blank (line or bar) Graph
This product can be for multiple uses! It contains a numbered x and y axis, a blank heading for students to write in a title, and blank headings for axis labels.I used the blank graph for my students to graph their test scores and then mark their goal for their next test creating an accountability factor for testing.
Grades:
Not Grade Specific

Creating Data Tables and Graphs in Google Sheets
This is an activity that walks students through the process of organizing and entering data into a data table and then using that data to generate line, bar, and pie charts. Once the graphs are generated, the process of formatting and editing the different parts of each graph is explained.

Printable Graph Paper 10 Squares Per Inch Cross Stitch
Printable Graph Paper 10 Squares Per Inch Cross Stitch - Grid paper is essentially the type of paper most commonly used for drawing and sketching purposes. It is widely used for making plan charts, designing websites, developing home ideas and so forth. A great deal of businesses who need to produce a company card, business brochures, catalogues, brochures, and so forth need this kind of graph paper.
Subjects:
Grades:
5th - 12th

Weather Tracking in Excel
Compatible with Google Sheets, Google Classroom, or as a stand-alone file on a PC, this product is a must have for any teacher comparing weather conditions in multiple locations!
BEFORE YOU BUY: This file is part of a larger unit. Save yourself money by purchasing the Super Science Set for Weather and Climate nstead of buying each file separately.
Purchased alone, you get:
⭐ An Excel workbook that enables students to track the weather for 5 different locations as a whole class or individ
Subjects:
Grades:
4th - 8th
Types:

LINE GRAPH MAKER (AUTOMATIC)
This spreadsheet allows you to insert your independent and dependent variables into a chart and voila!... a line graph is generated as you enter in each piece of new data! Students love to take their data from a lab and watch as a graph is made right before their eyes! You can change all of the titles on the chart and the graph to suit your classes laboratory experiment needs! Students can easily print out their data to include in their lab reports!
Grades:
2nd - 12th
Types:

Halloween Candy Computer Graphing for Primary Kids
Want an engaging way to capitalize your students' excitement about Halloween, technology and math? Creating a pictograph on the computer is an ideal way to combine all three and is ideal for both the Technology Specialist as well as the Classroom Teacher!Halloween Candy Computer Graphing includes the following activities:Sort and counti pictures of different Halloween candies Complete a tally marks sheet with the data and convert tally marks into numbersEnter data into a pre-formatted Excel or
Grades:
PreK - 2nd
Types:

Water Balloon Catcher Project - Data and Graphing - Mathematics
Transform your maths classroom into a dynamic hub of learning with this captivating data and graphing project! Designed for upper primary/middle school students, this hands-on and inquiry-based activity ensures an immersive experience in mastering data interpretation, chart creation, and understanding the role of data and graphs in advertising.In this engaging project, students will: Explore Data: Collaborate in teams to design and construct a Water Balloon Catcher using recycled materials, each
Subjects:
Grades:
5th - 9th
Types:

EDITABLE Excel Graphing Template
Teach graphing in Excel with this EDITABLE template! After collecting data, have your students represent it in a formal graph using Excel. This template provides helpful tips for students to determine the right kind of graph (bar, line, or pie) for their data and ALSO teaches them all the important parts of a graph.Assign the template for students to download and edit for a quick graphing solution or provide the pdf handouts for students who just need a little guidance!4 different kinds of graph
Grades:
7th - 12th
Types:

Behavior Observation Academic Engagement and Time on Task (BOSS) AUTO GRAPH
This form is intended to collect on-task/off-task data. It will AUTO graph. This is used to quantify a student's academic engagement and off-task behaviors. Momentary time sampling recording is used. This form measures a student’s active engaged time (AET) and/or passive engaged time (PET). In terms of off-task behaviors, this form measures off-task motor (OFT-M), verbal (OFT-V), and passive behaviors (OFT-P). EXCEL DOCUMENT.
Subjects:
Grades:
Not Grade Specific

Graph Daily Temperature - with handout
Lots of downloads, are there any comments or votes for me? :)
Type in the daily temperature on your computer with your students and it will automatically graph it for you as you type. You can pre-print the monthly graph for everyone in your class and they can follow along and graph with you. I use it with calendar math or other daily activities.
Great for explaining the scales of a graph and practicing accuracy in graphing and using rulers to connect lines. Look for trends in weather and a
Subjects:
Grades:
3rd - 6th
Types:
Showing 1-24 of 258 results

TPT is the largest marketplace for PreK-12 resources, powered by a community of educators.
IXL family of brands