14 results
Graphing classroom forms for Microsoft Excel
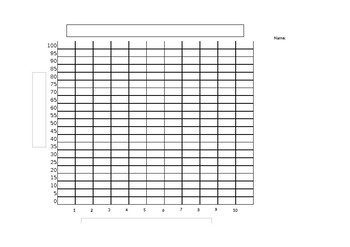
Blank (line or bar) Graph
This product can be for multiple uses! It contains a numbered x and y axis, a blank heading for students to write in a title, and blank headings for axis labels.I used the blank graph for my students to graph their test scores and then mark their goal for their next test creating an accountability factor for testing.
Grades:
Not Grade Specific
Graphed Behavior Data Spreadsheet (Pre-Dated 2023-24 School Year)
Easily Graph student behavior data with this pre-formatted Excel spreadsheet. Simply enter the students' data in the spreadsheet and the document creates a colorful data graph. There is a spreadsheet and data graph pre-populated for each weekday of the 2023-2024 school year.
Subjects:
Grades:
Not Grade Specific
Types:
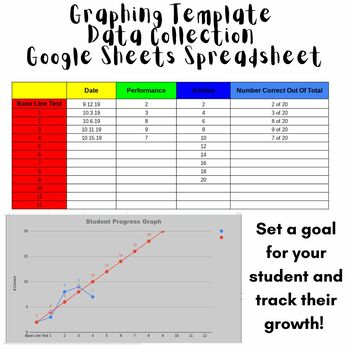
Data Collection Graph Template - Great for IEP GOALS!
Organize your data for students GOALS! Great way to TRACK and show GROWTH for progress monitoring with IEP GOALS, or really...any goals your students have! This is a spreadsheet set up for google sheets. All you need to do is enter the students information, their goal, and start tracking! Enter each time you test a student how they do, and a graph will be generated.
Subjects:
Grades:
Not Grade Specific
Types:
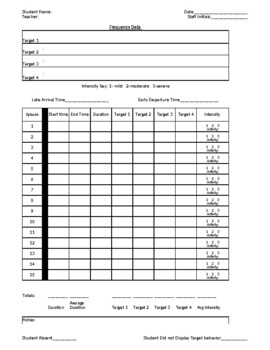
Behavior Frequency Rate Chart w/ Target, Intensity, Duration, BIP chart/Summary
Behavior Frequency Rate Chart (dates and chart cant be edited and dates changed to current year or target)--Daily Sheet-Date Entry-Intensity Chart-Duration Chart-Target Charts-BIP Evaluation printout -BIP write upSee preview for description Excel format for editing - tabs at bottom of page for easy change of view and data entry
Subjects:
Grades:
PreK - 12th
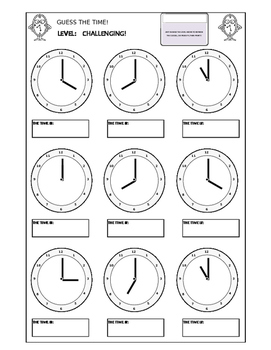
Clocks - Guess The Time
An easy way to produce hundreds of clock worksheets so that your students can practice working out the time. This is an Excel worksheet with 9 clocks, that refresh randomly to produce any number of random print outs.
There are three levels (Challenging, Really Hard, and Nightmarish!), corresponding to Easy (K, G1), Medium (G2, G3) and Hard (G4, G5). You only have to change levels or refresh the page (F9 for a PC) and you have a new sheet.
Tab 1 ("GUESS") is for guessing the time from a clock.
Subjects:
Grades:
K - 7th
Types:
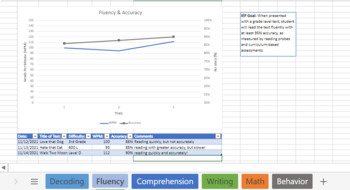
IEP Data Bundle
This bundle has it all! The IEP data sheet template is a printable resource that helps you keep a student's IEP goals and data all in one place! Just copy and paste your IEP goals or objectives in the space provided, print, and use to gather progress monitoring data. Take your data to the next level by uploading the data to an online spreadsheet. When used together, these data-driven products allow you to monitor progress on IEP goals and objectives, upload your data into a digital format an
Grades:
Not Grade Specific
Types:
Graph Paper
This Excel file contains three different sizes of printer-ready graph grids -- 0.25" x 0.25", 0.50" x 0.50", and 1.0" x 1.0".
Subjects:
Grades:
Not Grade Specific
Types:
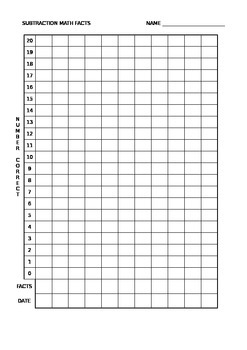
Subtraction Facts - Chart of Progress for Students *Editable!
This is a great little graph your students can use to chart their progress with their math facts. I have left this as an excel spreadsheet so that you can edit it as needed. The graph includes a place for the date, type of math fact (-1, -2, etc), number of facts completed, and room for your student to color in how many facts they completed for the day. Students really love seeing the progress they make! Great to use at conferences or to turn in as artifacts for your professional development por
Subjects:
Grades:
K - 3rd
Types:
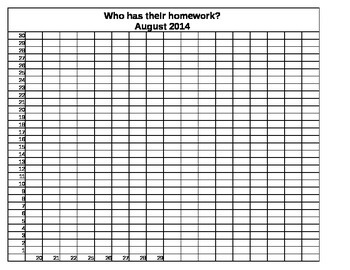
Home work Data wall
This is a quick easy way to see who has brought homework and collect class data.
Subjects:
Grades:
Not Grade Specific
Types:
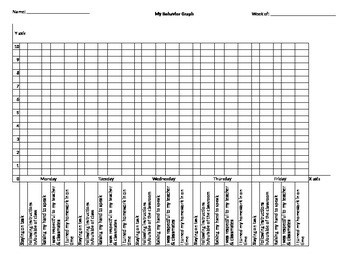
Behavior Graph
Students graph their behavior throughout the week. It is a good visual for them to see which areas they need to improve upon.
Subjects:
Grades:
1st - 4th
Types:
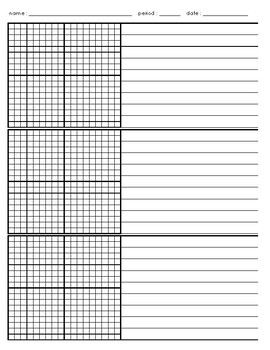
graph paper in excel
this excel template has space for 3 graphs and work shown
Subjects:
Grades:
6th - 12th
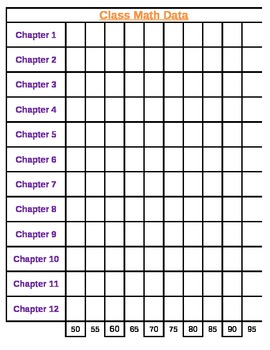
Math Class Data Sheet
Great for a class Data Wall!
This is an excel spreadsheet used to track yearly growth.
Enjoy!
Subjects:
Grades:
K - 12th
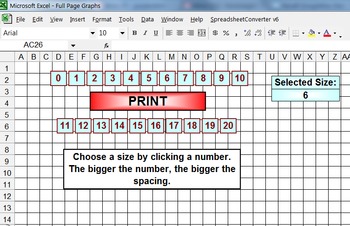
Full Page Graph Grids
This is an Excel file that creates 21 different sized graph grids with the touch of a button.
Grades:
K - 12th, Staff
Types:
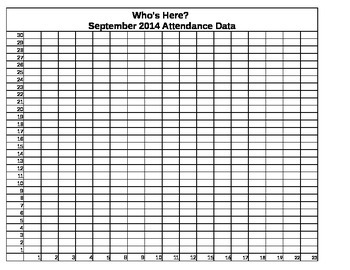
Attendance Data wall
This is a simple way to track data using attendance in you classroom.
Subjects:
Grades:
Not Grade Specific
Types:
Showing 1-14 of 14 results


