25 results
Not grade specific graphing resources for Microsoft Excel
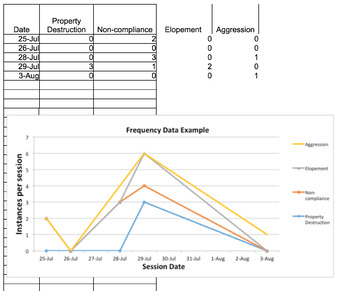
Graphing Basic Applied Behavior Analysis Data
This is a great resource for students or teachers that are new to learning how to graph frequency data (e.g., instances of aggression), accuracy data (e.g., % of correct sight words), baseline and treatment data, along with a few more. Each tab contains an example of data that is entered, as well as a (labeled) graph to accompany that data. It is very easy to edit and can be used to graph a multitude of different types of data. It is also a wonderful resource for therapists and other clinicians
Subjects:
Grades:
Not Grade Specific
More Graphs Added! Graphing Basic Data For Students: An Excel Workbook
This is a great resource to use for data tracking for all of your students or clients. I have expanded the other Graphic Workbook on my TPT store. This resource is made to easily create graphs for a variety of skills or behaviors. As a result, this excel workbook can be used by teachers, behavior analysts, speech therapists, behavior intervention specialists, really anyone who needs data collection. The graphs can be shared during parent-teacher conferences, IEP meetings, included in student pro
Subjects:
Grades:
Not Grade Specific
Types:
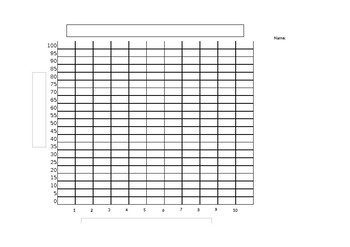
Blank (line or bar) Graph
This product can be for multiple uses! It contains a numbered x and y axis, a blank heading for students to write in a title, and blank headings for axis labels.I used the blank graph for my students to graph their test scores and then mark their goal for their next test creating an accountability factor for testing.
Grades:
Not Grade Specific
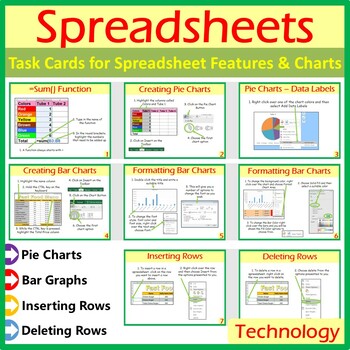
Microsoft Excel Spreadsheet Features & Chart Task Cards Help Cards
A wonderful set of 8 task/instruction cards which can be printed and laminated and then given to students to help them learn and practise the following features in Microsoft Excel:• =sum()• Creating pie charts• Inserting data labels on pie charts• Creating bar charts• Formatting bar charts• Inserting rows in spreadsheets• Deleting rows in spreadsheetsOther Microsoft Excel Products Available:• Microsoft Excel Bundle 1: Click Here• Microsoft Excel Bundle 2: Click Here• Grades 1- 4: Microsoft Excel
Grades:
Not Grade Specific
Types:
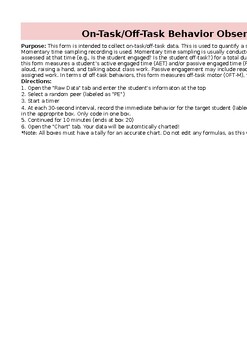
Behavior Observation Academic Engagement and Time on Task (BOSS) AUTO GRAPH
This form is intended to collect on-task/off-task data. It will AUTO graph. This is used to quantify a student's academic engagement and off-task behaviors. Momentary time sampling recording is used. This form measures a student’s active engaged time (AET) and/or passive engaged time (PET). In terms of off-task behaviors, this form measures off-task motor (OFT-M), verbal (OFT-V), and passive behaviors (OFT-P). EXCEL DOCUMENT.
Subjects:
Grades:
Not Grade Specific
Graphed Behavior Data Spreadsheet (Pre-Dated 2023-24 School Year)
Easily Graph student behavior data with this pre-formatted Excel spreadsheet. Simply enter the students' data in the spreadsheet and the document creates a colorful data graph. There is a spreadsheet and data graph pre-populated for each weekday of the 2023-2024 school year.
Subjects:
Grades:
Not Grade Specific
Types:
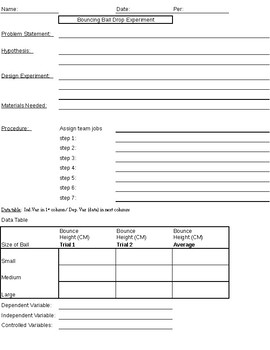
Science: Simple Bouncing Ball Experiment With Data Table & Graph Practice
This simple experiment can be used in open inquiry by giving students three different sized balls and a meter stick so they can design their own experiments. Included (all black & white pages - easy to copy): (1) teacher reference page to give students much or little guidance.(2) pages for students to write a problem statement, hypothesis, experiment design, materials needed, procedure, data table (for independent and dependent variables), an area for a graph, and conclusion. Some Ideas F
Subjects:
Grades:
Not Grade Specific
Types:
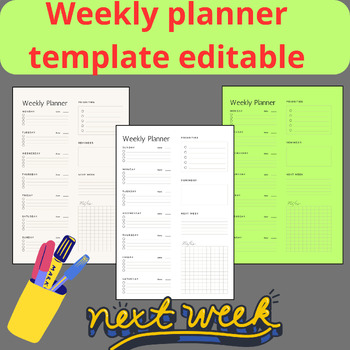
Weekly planner template editable _ Editable daily weekly teacher planner digital
The weekly planner template is a useful tool for organizing and managing tasks, appointments, and activities throughout the week. This editable weekly planner template provides the flexibility to customize and adapt the design to suit your specific needs and preferences. Here is a description of a typical editable weekly planner template: 1. Layout: The template usually features a clean and organized layout with the days of the week arranged horizontally from Monday to Sunday. 2. Editable Fi
Subjects:
Grades:
Not Grade Specific
Types:
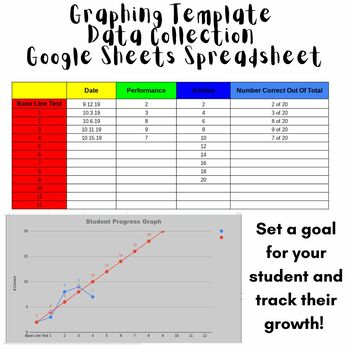
Data Collection Graph Template - Great for IEP GOALS!
Organize your data for students GOALS! Great way to TRACK and show GROWTH for progress monitoring with IEP GOALS, or really...any goals your students have! This is a spreadsheet set up for google sheets. All you need to do is enter the students information, their goal, and start tracking! Enter each time you test a student how they do, and a graph will be generated.
Subjects:
Grades:
Not Grade Specific
Types:
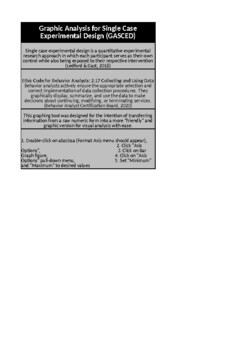
Graphic Analysis for Single Case Experimental Design (GASCED)
This graphing tool was designed for the intention of transferring information from a raw numeric form into a more "friendly" and graphic version for visual analysis with ease. While this tool can be used for single case research design, it can also be used for IEP data. It is important for all special educators to a) take data & b) present that data in a way that everyone can understand. This tool can help with IEP compliance.
Grades:
Not Grade Specific

5 Projects to Integrate Technology in Math Lessons
What's included in the Math bundle: * Five step-by-step lessons, including reproducibles, grading rubrics, sample projects, extensions for advanced students and troubleshooting tips where applicable * A brief summary of each project, including suggested grade level and prior knowledge, time required, software required * Higher-order thinking skills addressed * Technology-specific skills taught (including ISTE)Projects include: Keeping a Timecard in Excel, Beginning Graphs with Excel,
Subjects:
Grades:
Not Grade Specific
Types:

Small, Medium, Large Student Graph Paper
Three blank editable excel sheets in small, medium and large
Subjects:
Grades:
Not Grade Specific
Types:
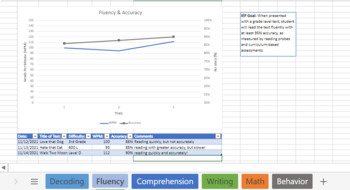
IEP Data Bundle
This bundle has it all! The IEP data sheet template is a printable resource that helps you keep a student's IEP goals and data all in one place! Just copy and paste your IEP goals or objectives in the space provided, print, and use to gather progress monitoring data. Take your data to the next level by uploading the data to an online spreadsheet. When used together, these data-driven products allow you to monitor progress on IEP goals and objectives, upload your data into a digital format an
Grades:
Not Grade Specific
Types:
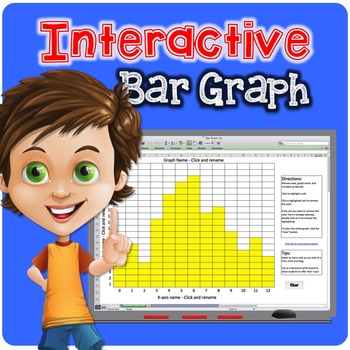
Interactive Bar Graph or Histogram
Brand New! FREE! Graphing has never been so fun! Perfect for Smart Board or Promethean Board graphing! Simply click on a cell to highlight it. Click again to un-highlight it, or press clear to remove all of the input! Use over and over again!
Completely customizable. Change the x- and y-axes names as well as the bar graph name and even the numbers lining the axes. Create bar graphs or histograms depending on how you customize it!
Please note, this is a Microsoft Excel file. In order to use thi
Grades:
Not Grade Specific
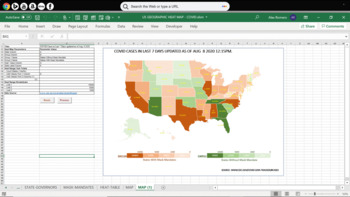
US Geographic Heat Map Generator
Using simple VBA code, this versatile Excel tool generates multi-variate geographic heat map using data files downloaded from publicly available sources.Watch the Youtube video to see how it works:https://www.youtube.com/watch?v=bJCgWko-2Bs
Subjects:
Grades:
Not Grade Specific

Graph Paper
This Excel file contains three different sizes of printer-ready graph grids -- 0.25" x 0.25", 0.50" x 0.50", and 1.0" x 1.0".
Subjects:
Grades:
Not Grade Specific
Types:
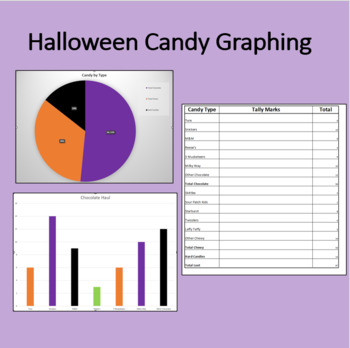
Halloween Candy Graphing- Intro to Excel-Use Your Data to Create Fun Charts
Extend the fun of Halloween by creating visuals of the loot. Students tally and total by candy and type. Each student can enter data and charts will automatically update for visualization. See what Excel can do!
Subjects:
Grades:
Not Grade Specific
Types:
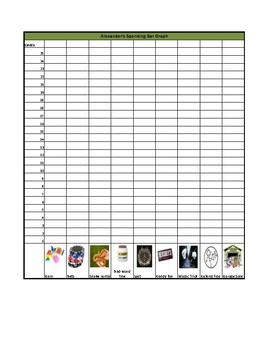
Alexander, Who Used to Be Rich Last Sunday Bar Graph
This is great companion to the story Alexander, Who Used to Be Rich Last Sunday. Students are able to develop a bar graph by shading in the number of cents spent on each item. The bar graph also includes pictures of each item to help those students who need visual representation. At the end of this activity, students will have a visual representation of all the money spent by Alexander. They will be able to use this worksheet to answer the following questions: What item did Alexander spent t
Grades:
Not Grade Specific
Types:
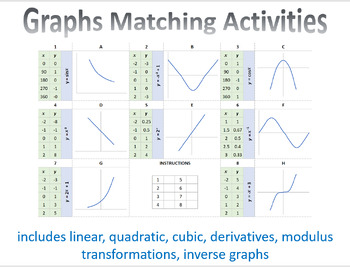
Graphs Matching Activity
Tables and equations can be matched with corresponding graph or pairs of graphs can be matched with each other (columns can easily be hidden if not required).The resource can be used as a class activity or ideal as a starter or plenary.The macro enabled Excel file is fully editable and includes Linear, Quadratic, Mixed, Derivatives, Transformations, Modulus, Inverse graphs. New worksheets can be added by running InsertSheet macro.Double click on cell to highlight content.Files are updated on a r
Grades:
Not Grade Specific
Types:
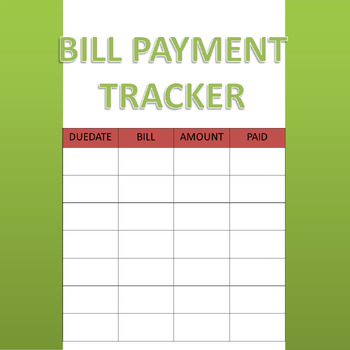
BILL PAYMENT TRACKER, COLOR
This bill payment tracker will help you to record and track your bill payments. You can use it to budget your monthly expenses and to make sure that you never miss a payment. The tracker includes space to record the date, amount, and method of payment for each bill.
Subjects:
Grades:
Not Grade Specific
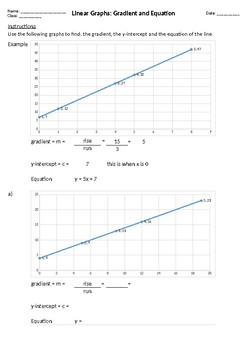
Find the Gradient and Equation from the Graph
In this worksheet students are required to use the linear graph to find:the gradient (m) using rise over runthe y-intercept (c)the equationThe worksheet is randomisable by pressing F9 on your keyboard. This will help teachers save time by not needing to prepare a new worksheet every time you wish to support students learning for this topic.Solutions are included.
Grades:
Not Grade Specific
Types:
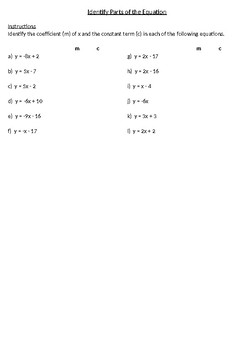
Linear Equations: Identify the Elements
Identify m and c from linear equations.The worksheet is randomisable by pressing F9 on your keyboard. This will help teachers save time by not needing to prepare a new worksheet every time you wish to support students learning for this topic.Solutions are included.
Grades:
Not Grade Specific
Types:
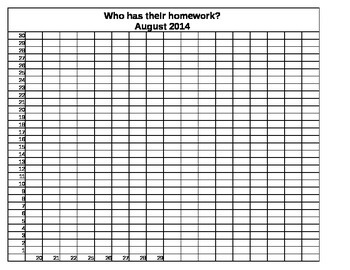
Home work Data wall
This is a quick easy way to see who has brought homework and collect class data.
Subjects:
Grades:
Not Grade Specific
Types:
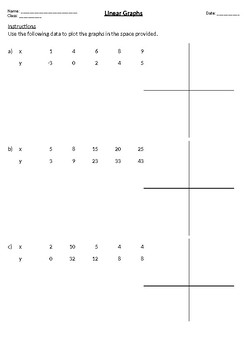
Plot the Linear Graph
Use the data points to plot the linear graph.The worksheet is randomisable by pressing F9 on your keyboard. This is so teachers can save time by not needing to create a new worksheet manually every time you want to support students with this topic.Solutions are included.
Grades:
Not Grade Specific
Types:
Showing 1-24 of 25 results


