Graphing Basic Applied Behavior Analysis Data
Beyond Therapy Consulting LLC
74 Followers
Grade Levels
Not Grade Specific
Subjects
Resource Type
Formats Included
- XLS
Pages
6 pages
Beyond Therapy Consulting LLC
74 Followers
Description
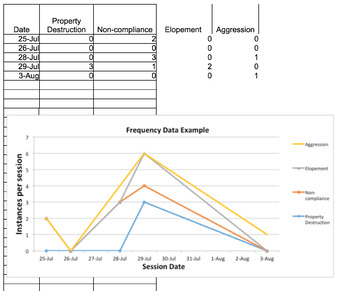
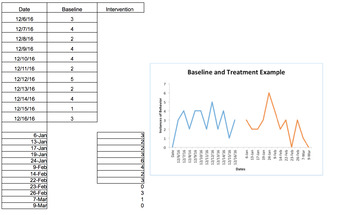
This is a great resource for students or teachers that are new to learning how to graph frequency data (e.g., instances of aggression), accuracy data (e.g., % of correct sight words), baseline and treatment data, along with a few more.
Each tab contains an example of data that is entered, as well as a (labeled) graph to accompany that data. It is very easy to edit and can be used to graph a multitude of different types of data.
It is also a wonderful resource for therapists and other clinicians that need to quickly graph data for those (lengthy) reports!
* Please note that the thumbnails don't do a great job of displaying the format correctly!
Total Pages
6 pages
Answer Key
N/A
Teaching Duration
N/A
Report this resource to TPT
Reported resources will be reviewed by our team. Report this resource to let us know if this resource violates TPT’s content guidelines.


