Real World Data for Statistical Analysis and Infographic Project
- Zip
- Google Apps™
- Excel Spreadsheets

Description
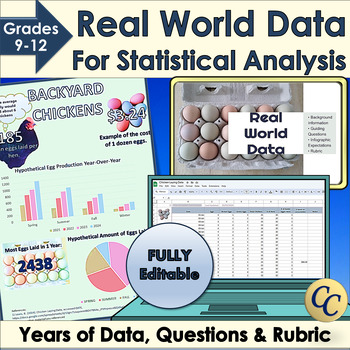
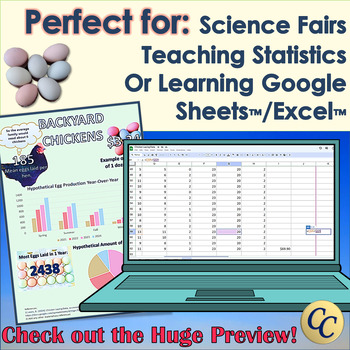
Give your students access to real world data for your statistical analysis unit or data literacy! Dive into statistics with Microsoft Excel™ or Google Sheets™ and years of data. Learn how to use standard deviation, mean or median to interpret data. Choose the best graphs to display conclusions in an infographic. Works great for science fairs!
✔ Includes an infographic project! (Template, expectations, and rubric).
✔ Everything is fully editable and you and your students can even use the images in this resource for your projects!
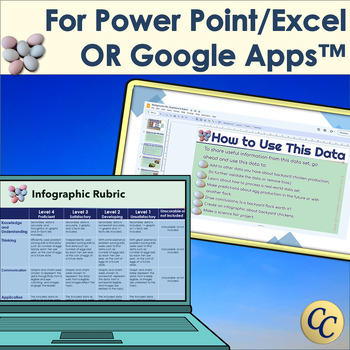
This is a zip-file that includes Power Point™ and Excel™ files, as well as links to Google Slides™ and Sheets™
⏰ 1-2 weeks of class work.
The data includes:
- Records on a backyard chicken farm from 2020 to April 2024!
- A variety of parameters to consider and compare, (eggs per day, cost of consumables, how many active hens, and size of flock).
- Updates on the data in Google Sheets™ as it is available. (You can always have current and relevant data.)
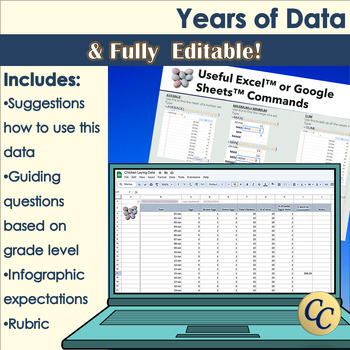
There are also resources to help you and your students use this data for learning, such as:
- Tips on how to use this data.
- Guiding questions based on grade level to shape science projects or data analysis.
- Everything you need to have your students create an infographic based on this data, (template, expectations, and rubric.)
Check out the huge preview!
Teach your students to find good sources and how to cite them here!
To be notified of all the latest from The Christian Curriculum, follow me.


