26 results
Graphing simulations for Microsoft Excel
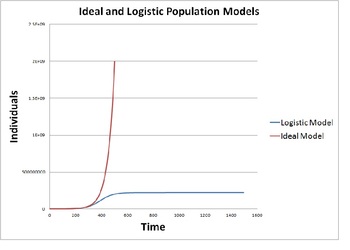
Modeling Population Growth (Ideal vs. Logistic Model)
This activity provides instructions to construct a mathematical model on a blank spreadsheet that simulates population growth using an ideal model and a logistic model. The activity provides background discussion and then gives instructions on how to program a spreadsheet to produce and display the ideal and logistic population models. Their results are studied for various cases including human population, rabbits, polar bears, bacterial and yeast colonies.
This quantitative population model
Subjects:
Grades:
9th - 12th, Staff
Types:
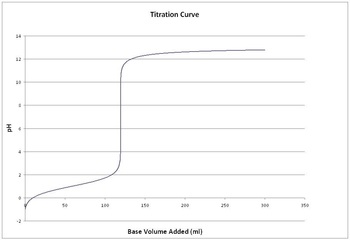
Simulating Titration of Acid on a Spreadsheet
This activity guides students to construct a spreadsheet from a blank Excel workbook that will simulate titration of acids or bases.
*Teacher background on Excel is not required*
After constructing the spreadsheet and graphs the students will experiment with the spreadsheet to answer analysis questions that will help students learn the mathematical nature of titration (solutions are provided including descriptions of all spreadsheet manipulations necessary to solve each problem).
The va
Subjects:
Grades:
10th - 12th, Higher Education
Types:
Demonstrate Line Fitting with an Animated Excel File
Simple to use animated Excel file for in class demonstration of Line Fitting using linear regression. Move scroll bars, select option buttons, type numbers, and watch these mathematical concepts come alive. You must use Microsoft Excel that is capable of opening file formats in either .xlsx or .xlsm.
Subjects:
Grades:
9th - 12th
Types:
Demonstrate Exponential Functions with an Animated Excel File
Simple to use animated Excel file for in class demonstration of exponential function graphs, specifically, growth, decay, f(x)=ab^x, vertical shift, horizontal shift, and f(x)=ab^(x-h)+k. Move scroll bars, select option buttons, type numbers, and watch these mathematical concepts come alive. You must use Microsoft Excel that is capable of opening file formats in either .xlsx or .xlsm.
Subjects:
Grades:
9th - 12th
Types:
Demonstrate the Slope of Lines with an Animated Excel File
Simple to use animated Excel file for in class demonstration of the graph of lines with positive, negative, integer, fractional slopes. Also includes a worksheet that compares two lines with different slopes you can manipulate. Move scroll bars, select option buttons, type numbers, and watch these mathematical concepts come alive. You must use Microsoft Excel that is capable of opening file formats in either .xlsx or .xlsm.
Grades:
9th - 12th
Types:
Demonstrate Linear Equations in 2 Variable Graphs with an Animated Excel File
Simple to use animated Excel file for in class demonstration of Linear Equations in 2 Variables. Equation formats include general form, slope-intercept form, point-slope form, and point-point form. Move scroll bars, select option buttons, type numbers, and watch these mathematical concepts come alive. You must use Microsoft Excel that is capable of opening file formats in either .xlsx or .xlsm.
Subjects:
Grades:
8th - 12th
Types:
Demonstrate Quadratics in Completed Square Graphs with an Animated Excel File
Simple to use animated Excel file for in class demonstration of graphing quadratics in completed form such as y=ax², y-k=ax², y=a(x-h)², and y-k=a(x-h)². Move scroll bars, select option buttons, type numbers, and watch these mathematical concepts come alive. You must use Microsoft Excel that is capable of opening file formats in either .xlsx or .xlsm.
Subjects:
Grades:
9th - 12th
Types:
Demonstrate Absolute Value Equality in 2 Variables with an Animated Excel File
Simple to use animated Excel file for in class demonstration of solutions to absolute value equalities in 2 variables such as y=|x|, y=a|x|, y=a|x+b|, and y=a|x+b|+c. Move scroll bars, select option buttons, type numbers, and watch these mathematical concepts come alive. You must use Microsoft Excel that is capable of opening file formats in either .xlsx or .xlsm.
Grades:
7th - 12th
Types:
Demonstrate Absolute Value Equalities in 1 Variable with an Animated Excel File
Simple to use animated Excel file for in class demonstration of solutions to absolute value equalities in 1 variable such as |x|=d, |x-b|=d, a|x-b|=d, and a|x-b|+c=d. Move scroll bars, select option buttons, type numbers, and watch these mathematical concepts come alive. You must use Microsoft Excel that is capable of opening file formats in either .xlsx or .xlsm.
Grades:
7th - 12th
Types:
Demonstrate One-Variable Equations in 2-Dimensions with an Animated Excel File
Simple to use animated Excel file for in class demonstration of One-Variable Equations in 2-Dimensions. Graph types include vertical (x=c), horizontal (y=c), and both types on one graph. Move scroll bars, select option buttons, type numbers, and watch these mathematical concepts come alive. You must use Microsoft Excel that is capable of opening file formats in either .xlsx or .xlsm.
Subjects:
Grades:
7th - 12th
Types:
Demonstrate Graphing of Quadratics with an Animated Excel File
Simple to use animated Excel file for in class demonstration of graphing quadratic equations in standard form, completed square form, and factored form. Move scroll bars, select option buttons, type numbers, and watch these mathematical concepts come alive. You must use Microsoft Excel that is capable of opening file formats in either .xlsx or .xlsm.
Subjects:
Grades:
9th - 12th
Types:
Demonstrate Basic Statistics Plots with an Animated Excel File
Simple to use animated Excel file for in class demonstration of Basic Stem-n-Leaf plot, Box and Whisker plot, and Frequency plot. Move scroll bars, select option buttons, type numbers, and watch these mathematical concepts come alive. You must use Microsoft Excel that is capable of opening file formats in either .xlsx or .xlsm.
Grades:
6th - 12th
Types:
Demonstrate Graphing Quadratic Inequalities with an Animated Excel File
Simple to use animated Excel file for in class demonstration of graphing quadratic inequalities in standard form and completed square form with selectable inequality type and shading option. Move scroll bars, select option buttons, type numbers, and watch these mathematical concepts come alive. You must use Microsoft Excel that is capable of opening file formats in either .xlsx or .xlsm.
Subjects:
Grades:
9th - 12th
Types:
Demonstrate Inequalities in 1 Variable Graphs with an Animated Excel File
Simple to use animated Excel file for in class demonstration of Inequalities in 1 Variable graphs both simple and compound. Move scroll bars, select option buttons, type numbers, and watch these mathematical concepts come alive. You must use Microsoft Excel that is capable of opening file formats in either .xlsx or .xlsm.
Subjects:
Grades:
9th - 12th
Types:
Demonstrate Graphs of Inequalities in 2 Variables with an Animated Excel File
Simple to use animated Excel file for in class demonstration of graphing Inequalities in 2 Variables. The first worksheet uses one equation in standard form. The second worksheet graphs systems of linear inequalities. Both worksheets allows selectable inequalities and shading. Move scroll bars, select option buttons, type numbers, and watch these mathematical concepts come alive. You must use Microsoft Excel that is capable of opening file formats in either .xlsx or .xlsm.
Subjects:
Grades:
9th - 12th
Types:
Demonstrate Direct and Inverse Variation Functions with an Animated Excel File
Simple to use animated Excel file for in class demonstration of direct and inverse variation function graphs. Move scroll bars, select option buttons, type numbers, and watch these mathematical concepts come alive. You must use Microsoft Excel that is capable of opening file formats in either .xlsx or .xlsm.
Subjects:
Grades:
9th - 12th
Types:
Demonstrate Compare Basic Statistical Graphs with an Animated Excel File
Simple to use animated Excel file for in class demonstration of comparing basic statistical graphs such as XY-scatter, Line, Column, Bar/Histogram, Area, and Pie, with the ability to select Ribbon, 3-d Column, 3-d Bar, 3-d Area, or 3-d Pie. Move scroll bars, select option buttons, type numbers, and watch these mathematical concepts come alive. You must use Microsoft Excel that is capable of opening file formats in either .xlsx or .xlsm.
Grades:
6th - 12th
Types:
Demonstrate Slopes of Parallel & Perpendicular Lines with an Animated Excel File
Simple to use animated Excel file for in class demonstration of Slopes of Parallel and Perpendicular Lines. Move scroll bars, select option buttons, type numbers, and watch these mathematical concepts come alive. You must use Microsoft Excel that is capable of opening file formats in either .xlsx or .xlsm.
Grades:
7th - 12th
Types:
Demonstrate Graph Plotting Basics with an Animated Excel File
Simple to use animated Excel file for in class demonstration of Basic Graph Plotting. Move scroll bars, select option buttons, type numbers, and watch these mathematical concepts come alive. You must use Microsoft Excel that is capable of opening file formats in either .xlsx or .xlsm.
Grades:
7th - 12th
Types:
Demonstrate Rational Functions with an Animated Excel File
Simple to use animated Excel file for in class demonstration of rational function graphs. Move scroll bars, select option buttons, type numbers, and watch these mathematical concepts come alive. You must use Microsoft Excel that is capable of opening file formats in either .xlsx or .xlsm.
Subjects:
Grades:
9th - 12th
Types:
Demonstrate Exponential Growth & Decay with an Animated Excel File
Simple to use animated Excel file for in class demonstration of exponential growth and decay graphs with respect to finance. Move scroll bars, select option buttons, type numbers, and watch these mathematical concepts come alive. You must use Microsoft Excel that is capable of opening file formats in either .xlsx or .xlsm.
Subjects:
Grades:
9th - 12th
Types:
Demonstrate Solving Systems of Linear Equations with an Animated Excel File
Simple to use animated Excel file for in class demonstration of Solving Systems of Linear Equations using the graphing method. Move scroll bars, select option buttons, type numbers, and watch these mathematical concepts come alive. You must use Microsoft Excel that is capable of opening file formats in either .xlsx or .xlsm.
Subjects:
Grades:
9th - 12th
Types:
Demonstrate the Creation of a Pie Chart with an Animated Excel File
Simple to use animated Excel file for in class demonstration of creating a Pie chart from start to finish. Move scroll bars, select option buttons, type numbers, and watch these mathematical concepts come alive. You must use Microsoft Excel that is capable of opening file formats in either .xlsx or .xlsm.
Grades:
6th - 12th
Types:
Demonstrate Absolute Value Inequalities in 1 Variable with Animated Excel File
Simple to use animated Excel file for in class demonstration solutions to absolute value inequalities in 1 variable such as less than, less than or equal to, greater than, and greater than or equal to. Move scroll bars, select option buttons, type numbers, and watch these mathematical concepts come alive. You must use Microsoft Excel that is capable of opening file formats in either .xlsx or .xlsm.
Grades:
8th - 12th
Types:
Showing 1-24 of 26 results


