50 results
Graphing resources for Microsoft Excel and for homeschool
Excel Lessons - Creating Charts
No Prep! These lessons are great as a first Excel Chart lesson or for students already a little familiar with creating charts. Students love the data for these charts because the data is centered around things they love – their cell phones! In Lesson 1, students will create 5 different charts from step-by-step directions which include Chart Titles, Chart Styles, Axis Titles, Data Labels, and Moving Chart to its own Sheet.In Lesson 2, students will create 5 charts from provided data as well as ch
Grades:
5th - 12th
Types:
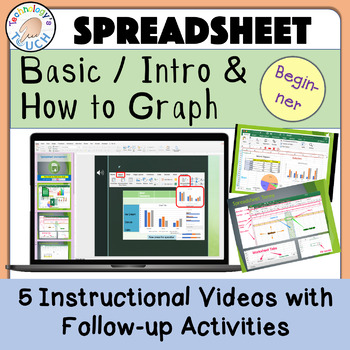
Spreadsheet - Basics Introduction & Graphing (Excel and Google Sheets)
This lesson guides students via animation and a tutorial video before completing the assignments. This is completely paperless with no prep, and lessons are done on either Microsoft Excel or Google Sheets. Students learn to enter data and start graphing. This resource is intended for learners first starting out or those who need a reminder on using spreadsheets or creating graphs. If you want your students' research papers to include eye-catching graphs, give this lesson a try. Start the slides
Subjects:
Grades:
1st - 8th
Types:

Excel Spreadsheets Million Dollars Activity
This resource allows students to understand the following: How graphs change when spreadsheet data is alteredUse of SUM() functionsHow graphs are madeComponents of a graphAdvantages of spreadsheets over pen and paper methodsStudents use this resource to understand how altering data in spreadsheets allow graphs to change. They understand such concepts by trying to spend a Million Dollars in a minute. Students are then expected to complete the associated worksheet which accompanies the spreadsheet
Grades:
5th - 12th, Adult Education
Types:
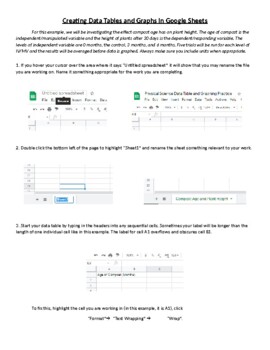
Creating Data Tables and Graphs in Google Sheets
This is an activity that walks students through the process of organizing and entering data into a data table and then using that data to generate line, bar, and pie charts. Once the graphs are generated, the process of formatting and editing the different parts of each graph is explained.

Parabola Transformations - Interactive
A handy guide to help new students learn how each change affects the shape and direction of parabolas. Clear color coding for the various pieces of the formula and instant updates help separate and isolate the concepts for easy, intuitive learning.Enter information using simple dropdown menus and organized blank fields to isolate each piece of the formula!Two tabs:One allows you to enter individual pieces of information to show the resulting formulaOne allows you to enter the formula to show the
Subjects:
Grades:
7th - 12th, Higher Education, Adult Education
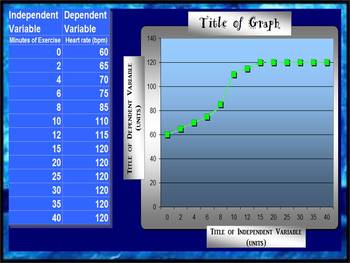
LINE GRAPH MAKER (AUTOMATIC)
This spreadsheet allows you to insert your independent and dependent variables into a chart and voila!... a line graph is generated as you enter in each piece of new data! Students love to take their data from a lab and watch as a graph is made right before their eyes! You can change all of the titles on the chart and the graph to suit your classes laboratory experiment needs! Students can easily print out their data to include in their lab reports!
Grades:
2nd - 12th
Types:
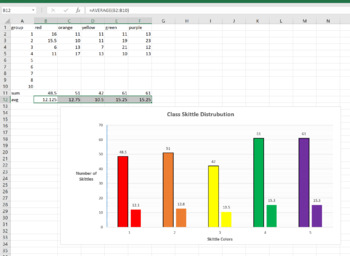
Skittle Statistics MS Excel Mini-Lab
This is a 1 class MS Excel lab for a computer or math class. You can have the students explore the distribution of different color Skittles in class. This is a great mini-lab or half-day activity when you school ends up with a weird schedule day. Tell them they can't eat till the Skittles till the end of class, or they will distort their numbers. Also make sure they don't throw them or shove them up their nose (Yes, stuck Skittles are hard to extract, ask me how I know..)The goal of this lab is
Grades:
6th - 12th, Higher Education, Adult Education
Types:
NGSS:
MS-ETS1-2
, HS-ETS1-2
, HS-ETS1-3
, MS-ETS1-4
, MS-ETS1-1
...
Also included in: Hands-on Science Semester Labs Bundle
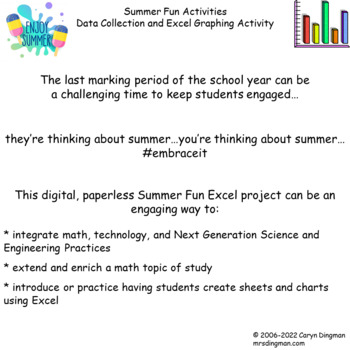
Excel Graphing Summer Fun with Digital Student Directions
The last marking period of the school year can be a challenging time to keep students engaged…they’re thinking about summer…you’re thinking about summer…#embraceitThis Summer Fun Excel project can be a perfect way to:* integrate technology* extend and enrich a math topic of study* introduce students to creating sheets and charts using ExcelProject file includes:* teacher notes/ classroom management suggestions* digital survey, using a Google Form, to collect summer activities data* digital stude
Subjects:
Grades:
3rd - 6th
Types:
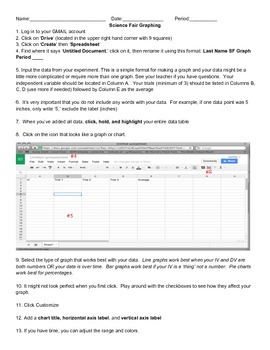
How To Graph Using Google Spreadsheets
This is a step-by-step guide on how to use Google Spreadsheets for students in grades 5-12. Use this as a resource when guiding students through the process. Included with the directions is sample data for students to use when practicing graphing. Perfect for science experiments and science fair!
Subjects:
Grades:
5th - 12th
Types:
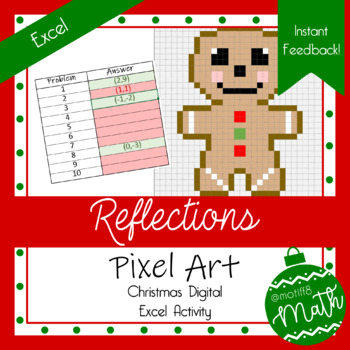
Christmas Pixel Art | Reflections | Digital Geometry | Instant Feeeback
Product Description: This Christmas themed, pixel art activity covers reflections! Students are given three points on a graph and asked to reflect one of the points. There are 10 problems. Students will reflect over the y-axis twice, the x-axis twice, the line y=x twice, a horizontal line twice, a vertical line once, and the y=-x line once.Objective: Students will be able to reflect points over various lines of reflection.Excel Student Instructions: Students will work all ten problems on the pro
Subjects:
Grades:
7th - 11th
Types:
Also included in: Christmas Transformation Bundle
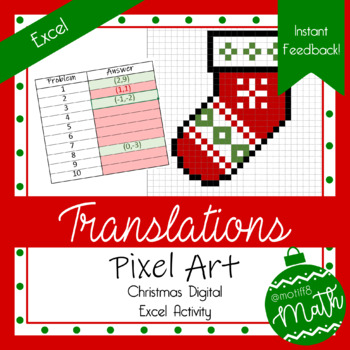
Christmas Pixel Art | Translations | Digital Geometry | Instant Feedback
Product Description: This Christmas themed, pixel art activity covers translations! Students are given three points on a graph and asked to translate one of the points according to the given translation rule.Objective: Students will be able to translate a point on a graph.Excel Student Instructions: Students will work all ten problems on the problems tab and then input their answers on the image tab. When entering their answers, students must use parentheses, a comma, and NO spaces. As students
Subjects:
Grades:
7th - 11th
Types:
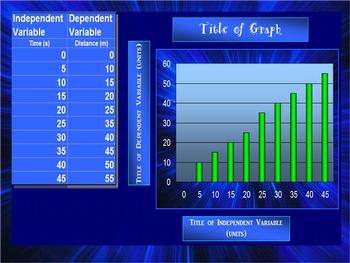
BAR GRAPH (AUTOMATIC)
This spreadsheet allows you to insert your independent and dependent variables into a chart and voila!... a bar graph is generated as you enter in each piece of new data! Students love to take their data from a lab and watch as a graph is made right before their eyes! You can change all of the titles on the chart and the graph to suit your classes laboratory experiment needs! Students can easily print out their data to include in their lab reports!
elementary science class, middle school sc
Grades:
2nd - 12th
Types:
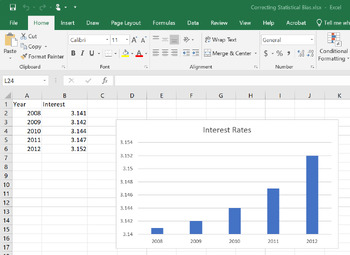
Correcting Statistical Bias with Answer Key
Correcting Statistical Bias is a great tool to use when teaching about statistical bias in the media, news, sports, and politics.It includes 4 graphs that have been manipulated to show bias.You can get your students to practice un-manipulating the graphs using the provided hints to show the real story behind the data and help your students to become more statistically aware.
Subjects:
Grades:
8th - 12th
Translations Christmas Bundle | Excel Pixel Art & Google Forms | Feedback
This Christmas bundle includes a 10 question Pixel Art Activity and a 10 question Google Form covering translations. The Pixel Art activity is more of an introduction to translations and the Google Form consisted of more advanced questions! This bundle would also be a great way to differentiate within your classroom or have options for a choice board! Please review each product individually for more details!Christmas Translations Pixel Art ActivityChristmas Translations Google Form
Subjects:
Grades:
8th - 11th
Types:
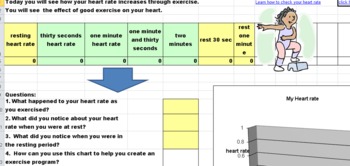
How can exercise effect your heart rate? -formulas, hyperlinks, andvideo
This spreadsheet is filled with an interactive graph based on real data that your students put into the spreadsheet. Their are hyperlinks for students to use (video and text for differentiation) to learn how to check their pulse. This would be a great lesson to complete for a heart healthy unit, or just to teach kids to stay active during wintery weather.
There are follow up questions that are at the bottom of the spreadsheet that will help them analyze their own data. Kids will love this les
Grades:
2nd - 6th
Types:
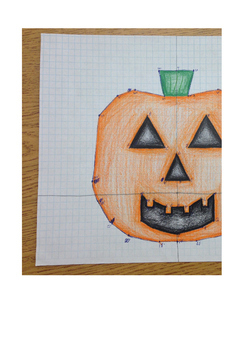
Pumpkin Transformations
This is a fun, artistic activity involving graphing on the coordinate plane, translations, and reflections. It is a great activity after translations and reflections have been taught, and best for doing in the
fall as the outcome is a pumpkin.
It could also be used as an assessment.
Materials needed: pencil, graph paper, crayons/markers/colored pencils.
Grades:
7th - 9th
Types:
Excel Graphing Valentine Candy Hearts Investigation
#welovecandyheartsThis integrated Math/ Science/ Technology project is a great way to make statistics and probability real, relevant, fun, and delicious!Students will create bar graphs using Excel to display Valentine candy hearts data, as students consider packaging and production of small Valentine candy heart individual boxes. Project file includes sample bulletin board display poster, project directions in individual student checklist form, and rubric to grade the finished graph.Project file
Grades:
5th - 7th
Types:
NGSS:
3-5-ETS1-2
, MS-ETS1-3
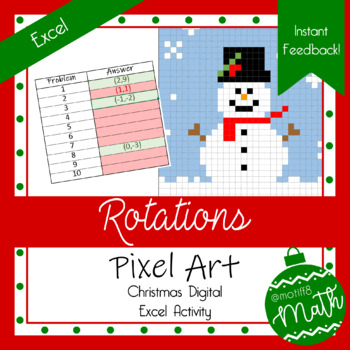
Christmas Pixel Art | Rotations | Digital Geometry | Instant Feedback
Product Description: This Christmas themed, pixel art activity covers rotations! Students are given three points on a graph and asked to rotate one of the points by 90°, 180°, or 270° either clockwise or counter clockwise on 9 of the problems. The last problem is a bit tougher because the students will need to know that rotating 90° three times is the same as a 270° rotation in the same direction.Objective: Students will be able to rotate points on a graph.Excel Student Instructions: Students wi
Subjects:
Grades:
7th - 11th
Types:
Also included in: Christmas Transformation Bundle
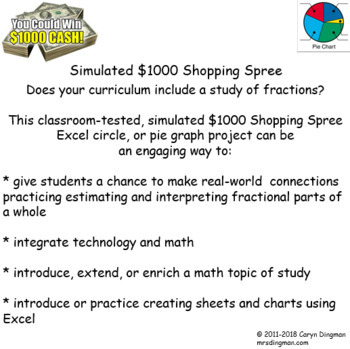
Excel Graphing $1000 Simulated Shopping Spree
Does your curriculum include a study of fractions?This classroom-tested $1000 Simulated Shopping Spree Excel circle, or pie graph project can be an engaging way to:* give students a chance to make real-world connections practicing estimating * interpret fractional parts of a whole in a way that's personal and unique* integrate technology and math* introduce, extend, or enrich a math topic of study* introduce or practice creating sheets and charts using ExcelThis classroom-tested project file in
Subjects:
Grades:
4th - 6th
Types:
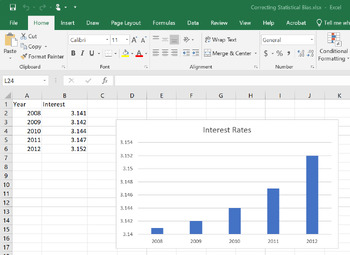
Correcting Statistical Bias
Correcting Statistical Bias is a great tool to use when teaching about statistical bias in the media, news, sports, and politics. It includes 4 graphs that have been manipulated to show bias.You can get your students to practice un-manipulating the graphs using the provided hints to show the real story behind the data and help your students to become more statistically aware.
Subjects:
Grades:
8th - 12th
Also included in: Correcting Statistical Bias with Answer Key
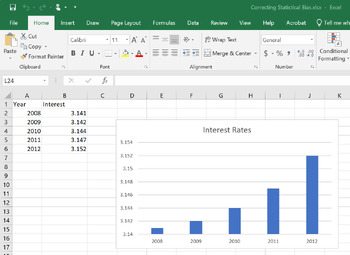
Correcting Statistical Bias Answer Key
This resource provides the answers for you and your students for the Correcting Statistical Bias lesson.
Subjects:
Grades:
8th - 12th
Also included in: Correcting Statistical Bias with Answer Key
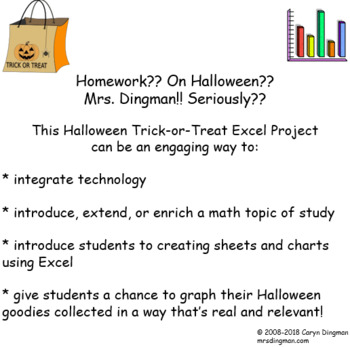
Excel Graphing Halloween Trick-or-Treat
Homework?? On Halloween?? Seriously??!!This Halloween Trick-or-Treat Excel Project, updated July 2018, can be an engaging way to:* integrate technology* introduce, extend, or enrich a math topic of study* introduce students to creating sheets and charts using Excel* give students a chance to graph their Halloween goodies collected in a way that’s real and relevant! This classroom-tested Halloween Excel project file includes: * student project directions sheet, in checklist form * rubric to score
Subjects:
Grades:
3rd - 6th
Types:
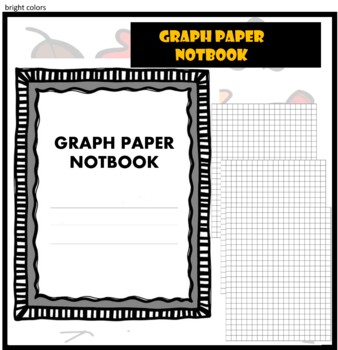
GRAPH PAPER NOTEBOOK
GRAPH PAPER NOTEBOOK 2022This paper book is a 102-page graph paper notebook consisting of pretty little square sheets in plain light blue, paper size 8.5 x 11 inches, 21.59 x 27.94 cm.★ ★This paperbook has several characteristics, including:· Plenty of space for writing or drawing· Font color is light blue· The size of the book is medium and suitable for different users and in different fields.· Pptx file containing lines and frame with transparent backgrounds that can be modified· JPG size 8.5
Subjects:
Grades:
7th - 12th, Higher Education, Adult Education, Staff
Excel Graphing Easter Fruit Snacks with Digital Student Directions
How About a Little Excel-lent Graphing to Add to Your Digital Learning Resources?Let’s Go Paperless!This digital, paperless Easter Fruit Snacks Data Collection and Excel Graphing Activitycan be an engaging way to:* integrate math, technology, and Next Generation Science and Engineering Practices* extend and enrich a math topic of study* introduce or give students additional practice creating sheets and charts using Excel* give students a real, personal, and unique way to compare data that’s fun
Showing 1-24 of 50 results


