15 results
Higher education graphing resources for Microsoft Excel
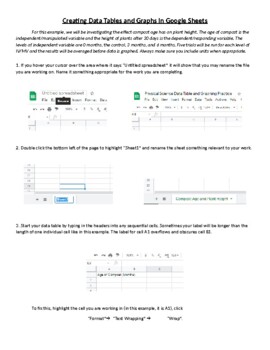
Creating Data Tables and Graphs in Google Sheets
This is an activity that walks students through the process of organizing and entering data into a data table and then using that data to generate line, bar, and pie charts. Once the graphs are generated, the process of formatting and editing the different parts of each graph is explained.

Parabola Transformations - Interactive
A handy guide to help new students learn how each change affects the shape and direction of parabolas. Clear color coding for the various pieces of the formula and instant updates help separate and isolate the concepts for easy, intuitive learning.Enter information using simple dropdown menus and organized blank fields to isolate each piece of the formula!Two tabs:One allows you to enter individual pieces of information to show the resulting formulaOne allows you to enter the formula to show the
Subjects:
Grades:
7th - 12th, Higher Education, Adult Education
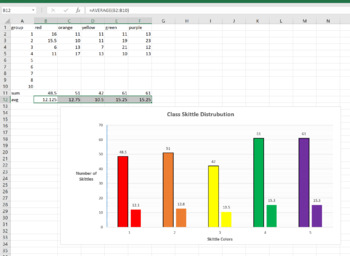
Skittle Statistics MS Excel Mini-Lab
This is a 1 class MS Excel lab for a computer or math class. You can have the students explore the distribution of different color Skittles in class. This is a great mini-lab or half-day activity when you school ends up with a weird schedule day. Tell them they can't eat till the Skittles till the end of class, or they will distort their numbers. Also make sure they don't throw them or shove them up their nose (Yes, stuck Skittles are hard to extract, ask me how I know..)The goal of this lab is
Grades:
6th - 12th, Higher Education, Adult Education
Types:
NGSS:
MS-ETS1-2
, HS-ETS1-2
, HS-ETS1-3
, MS-ETS1-4
, MS-ETS1-1
...
Also included in: Hands-on Science Semester Labs Bundle
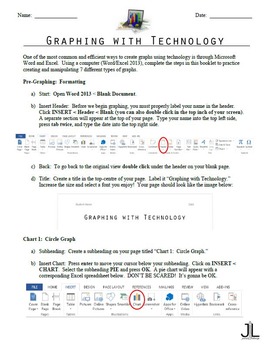
Graphing with Technology (Microsoft Word/Excel 2013)
Help students learn to create graphs using technology! This graphing with technology booklet acts as a compressed guide and practice sheet for Microsoft Word/Excel 2013.
Each graph contains step-by-step directions and screen-capture images so that students will never get lost. In addition, the data used in this assignment is both relatable and engaging for teenage target groups.
By completing this task, students will be able to create 7 different types of graphs using technology:
- pie gra
Subjects:
Grades:
8th - 12th, Higher Education, Adult Education
Types:
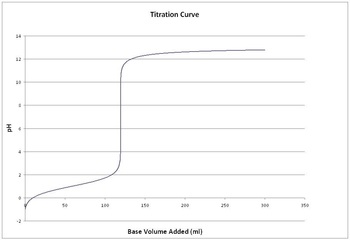
Simulating Titration of Acid on a Spreadsheet
This activity guides students to construct a spreadsheet from a blank Excel workbook that will simulate titration of acids or bases.
*Teacher background on Excel is not required*
After constructing the spreadsheet and graphs the students will experiment with the spreadsheet to answer analysis questions that will help students learn the mathematical nature of titration (solutions are provided including descriptions of all spreadsheet manipulations necessary to solve each problem).
The va
Subjects:
Grades:
10th - 12th, Higher Education
Types:
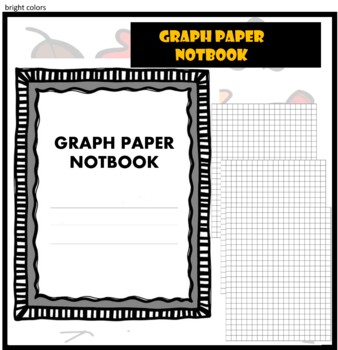
GRAPH PAPER NOTEBOOK
GRAPH PAPER NOTEBOOK 2022This paper book is a 102-page graph paper notebook consisting of pretty little square sheets in plain light blue, paper size 8.5 x 11 inches, 21.59 x 27.94 cm.★ ★This paperbook has several characteristics, including:· Plenty of space for writing or drawing· Font color is light blue· The size of the book is medium and suitable for different users and in different fields.· Pptx file containing lines and frame with transparent backgrounds that can be modified· JPG size 8.5
Subjects:
Grades:
7th - 12th, Higher Education, Adult Education, Staff
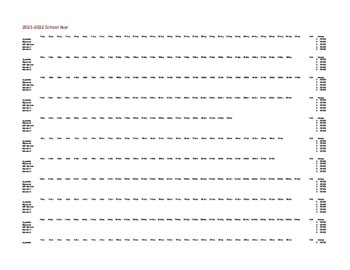
IEP Behavior Calculation
This template is a one stop shop. Insert your data and the rest is done for you. In this template you have the entire year month by month. Each month has 5 behaviors that you can calculate. Once you enter your numbers, the template will calculate the total and average, for each behavior, for that entire month. Once your month is filled out, you will go to the graph page where all your data will be graphed out for you.
Grades:
PreK - 12th, Higher Education, Adult Education
Types:
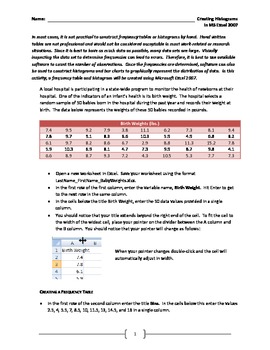
Creating Frequency Tables and Histograms in MS Excel 2007
This activity looks at a realistic data set and walks the student through constructing a frequency table and histogram using Microsoft Excel. It should be noted that Excel is not the best software package for creating histograms, but because it one of, it not the most widely used software package for data storage and presentation in business, it is important to know how to create professional-looking and statistically accurate graphics using this tool.
There are two different ways to constru
Subjects:
Grades:
11th - 12th, Higher Education
Types:
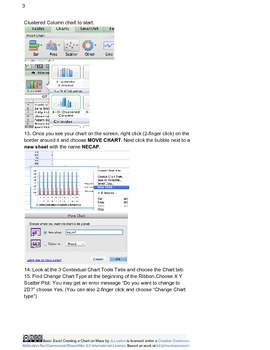
Basics of Excel: Working With Charts and Data on Macs
Step by Step lesson on creating charts, sorting and manipulating data in Excel Mac Version. This is a lesson for teachers trying to use assessment or other data to report or as a student lesson on using Excel.
Grades:
4th - 12th, Higher Education, Adult Education, Staff
Types:
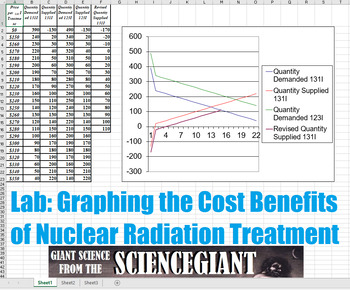
Lab: Graphing the Cost Benefits of Nuclear Radiation Treatment
Doctors sometimes administer a tiny dose of a radioactive isotope of iodine, iodine-131, to study the uptake by the thyroid gland. They COULD use iodine-123 to increase patient comfort, and require fewer extra hospital visits involved in repeated ablative sessions. But it costs more - a lot more. And the results might not be significantly better.
In this activity, Ss are challenged to use their graphing calculators (TI-83 or Excel spreadsheet), and their knowledge of physics, physicians, and
Subjects:
Grades:
9th - 12th, Higher Education
Types:

Duckweed Independent vs Dependent Growth Experiment and Paper
This is a fun lab experiment that I do with my sophomore biology students during our ecology unit. The students each have their own samples of duckweed (Lemna minor) and collect data over 2-3 weeks. They write a scientific paper afterwards. I have included basic lab instructions, student paper instructions, a spreadsheet that the students can put their collected data into, and a grading rubric. Edit the documents as needed for your class.
Grades:
10th - 12th, Higher Education
Types:
NGSS:
HS-LS2-1
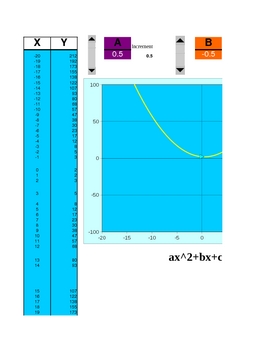
Functionator 5000 A graphing calculator/equation editor decay & growth
I built this Excel document to show what happens to lines and tables when you change variables and constants within an equations. There are three sheets:
y = mx+b
ax^2 + bx +c =0
c = p(1-r)^t
For instance, on the linear equation sheet, you can change m & b separately to see changes in the table and the graph. You can trace all equations. Much fun can be had.
Subjects:
Grades:
5th - 12th, Higher Education, Adult Education
Types:
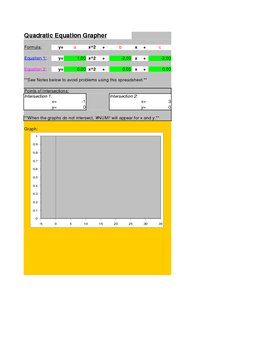
Quadratic Grapher
Quadratic Grapher MS Excel Spreadsheet graphs up to 2 quadratic equations / functions at a time. It is color coded so it is easy to see which parabola corresponds to which equation.
It also displays 10 points. The x values can be changed to your liking.
It also finds the points of intersection between the two parabolas. This is useful for solving a system of two quadratic equations. It could probably even solve a system of two equations that has one quadratic and linear equation. Just inp
Grades:
9th - 12th, Higher Education
Types:
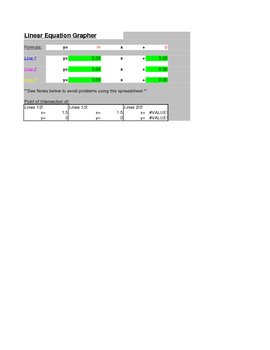
Linear Grapher
Linear Grapher Microsoft Excel Spreadsheet that allows you to graph up to 3 lines at a time. The lines are color coded with the equations, so you will know which line corresponds to which equation.
It also displays 10 points for each equation. The x values for these points can be adjusted.
It also finds the points of intersection for every pair of lines. This is helpful for system of equations.
It also has a seperate application built into the spreadsheet for finding the equation of a line
Grades:
8th - 12th, Higher Education
Types:

Terminal Velocity Simulation Written on a Spreadsheet
EXPAND THE USE OF SPREADSHEETS IN YOUR PHYSICS CURRICULUM... This Physics activity good for all levels of Physics is a free preview of "The Spreadsheet Lab Manual." It guides students to construct a mathematical simulation starting from a blank spreadsheet that quantitatively models freefall with air resistance as an object reaches terminal velocity. Students will be guided through an inquiry based simulation as they answer assessment questions and gain skills on spreadsheets while manipulati
Subjects:
Grades:
9th - 12th, Higher Education, Adult Education, Staff
Types:
Showing 1-15 of 15 results


