10 results
Graphing resources for Microsoft Excel and for staff
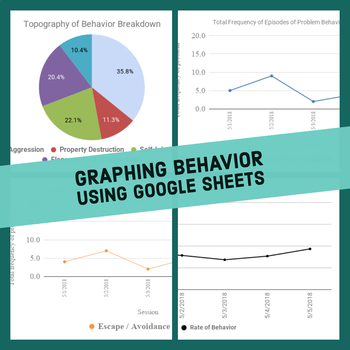
ABA Behavior Graph Excel Workbook
You do not need to purchase multiple licenses; feel free to use with as many clients as you want.Note: Email me at ian.vignes@atlasautismcenter.com for a link to the google sheets version, once you've made your purchase.Description: This file graphs behavior data for a single client. In it's current format, it records frequency and rate of behavior, as well as frequency of function of behavior. In addition, there is a pie chart breakdown of the percentage of each topography of behavior. For an
Grades:
Staff
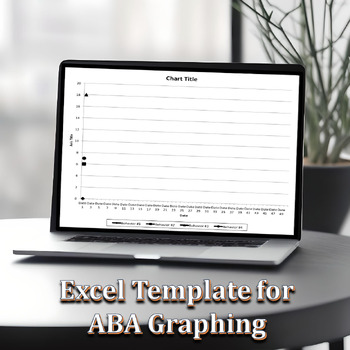
Excel Graphing Template for ABA
Use this Excel template to create a line graph in proper ABA format for behavioral data. An example of a graph is provided in this template. You may graph up to 4 behaviors at a time. To use: 1. Open the Excel file2. Fill in the 4 behaviors you would like to graph at the top (to replace Beh #1, Beh #2, etc)3. Fill in the dates you have data for (this graph is designed to hold 50 days worth of data)4. Fill in your behavioral data in the columns for each behavior5. Watch your graph change as you t
Subjects:
Grades:
Staff
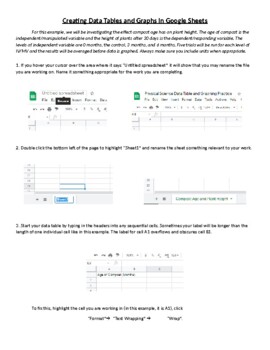
Creating Data Tables and Graphs in Google Sheets
This is an activity that walks students through the process of organizing and entering data into a data table and then using that data to generate line, bar, and pie charts. Once the graphs are generated, the process of formatting and editing the different parts of each graph is explained.
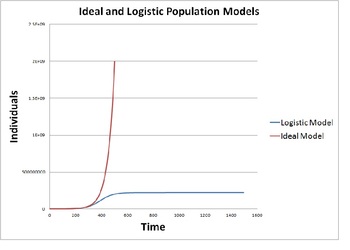
Modeling Population Growth (Ideal vs. Logistic Model)
This activity provides instructions to construct a mathematical model on a blank spreadsheet that simulates population growth using an ideal model and a logistic model. The activity provides background discussion and then gives instructions on how to program a spreadsheet to produce and display the ideal and logistic population models. Their results are studied for various cases including human population, rabbits, polar bears, bacterial and yeast colonies.
This quantitative population model
Subjects:
Grades:
9th - 12th, Staff
Types:
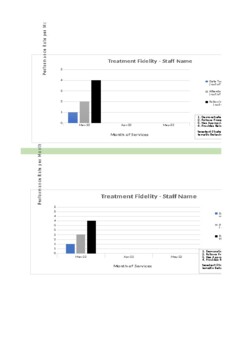
Fidelity Check with Graphs (Short)
Keep track of staff and treatment fidelity without distractions with this (weekly/monthly) checklist. Graphing is automatic and will generate based on the formula. Fully customizable to your companies specific goals and needs.
Subjects:
Grades:
Staff
Types:
GRAPH PAPER NOTEBOOK
GRAPH PAPER NOTEBOOK 2022This paper book is a 102-page graph paper notebook consisting of pretty little square sheets in plain light blue, paper size 8.5 x 11 inches, 21.59 x 27.94 cm.★ ★This paperbook has several characteristics, including:· Plenty of space for writing or drawing· Font color is light blue· The size of the book is medium and suitable for different users and in different fields.· Pptx file containing lines and frame with transparent backgrounds that can be modified· JPG size 8.5
Subjects:
Grades:
7th - 12th, Higher Education, Adult Education, Staff

Quadratic Graph Maker (Excel Templates)- Standard, Vertex, and Factored Forms
Easily Generate a Quadratic Graph/Parabola from a Template for Worksheets/Lessons/Notes:The Quadratic Graphing Template Excel file allows you to enter values into a table of values to easily create graphs of parabolas for any of the three forms (standard form, vertex form, factored form); all three forms of the equation are contained in one Excel file.The template is designed to include the vertex and 8 points before and after the vertex (the coordinates of the vertex in the table of values are
Subjects:
Grades:
9th - 11th, Adult Education, Staff
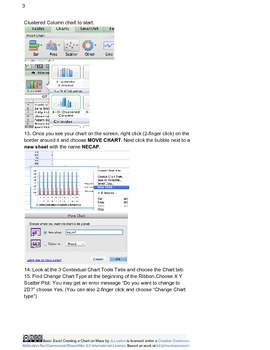
Basics of Excel: Working With Charts and Data on Macs
Step by Step lesson on creating charts, sorting and manipulating data in Excel Mac Version. This is a lesson for teachers trying to use assessment or other data to report or as a student lesson on using Excel.
Grades:
4th - 12th, Higher Education, Adult Education, Staff
Types:
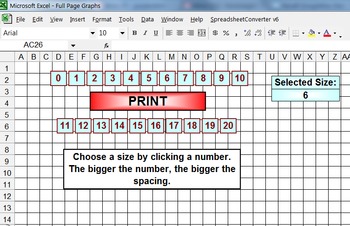
Full Page Graph Grids
This is an Excel file that creates 21 different sized graph grids with the touch of a button.
Grades:
K - 12th, Staff
Types:

Terminal Velocity Simulation Written on a Spreadsheet
EXPAND THE USE OF SPREADSHEETS IN YOUR PHYSICS CURRICULUM... This Physics activity good for all levels of Physics is a free preview of "The Spreadsheet Lab Manual." It guides students to construct a mathematical simulation starting from a blank spreadsheet that quantitatively models freefall with air resistance as an object reaches terminal velocity. Students will be guided through an inquiry based simulation as they answer assessment questions and gain skills on spreadsheets while manipulati
Subjects:
Grades:
9th - 12th, Higher Education, Adult Education, Staff
Types:
Showing 1-10 of 10 results


