4 results
Graphing homeschool curricula for Microsoft Excel
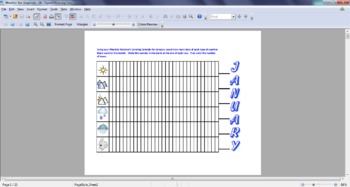
Weather Watcher's Monthly Bar Graph
After collecting data for the month on the Weather Watcher's Coloring Calendar, use this blank chart for analyzing the amount of each type of weather experienced in that month. This chart features colorful, easy to identify symbols for basic types of weather and clear instructions. All 12 months included in this package.
Subjects:
Grades:
K - 3rd
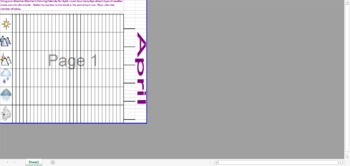
April Weather Watcher's Bar Graph
Complete this bar graph at the end of the month to total up the number of days each type of weather happened in the month. A great way to review and combine math with science skills.
Subjects:
Grades:
K - 4th
Free Tree Measurement Data
Teaching circumference and diameter conversions? Teaching graphing or data literacy? Here is dataset of 50 trees you can use to explore! Excel file includes #, diameter of tree, and whether it is a deciduous or coniferous. It's an easy way to use real science data in the classroom. Goes great with Tree Measuring Lab.
Subjects:
Grades:
6th - 10th

Pictograph Fun For All Ages
This is an excel document for busy teachers whom are trying to teach students to read picture graphs. The teacher will be able to edit the document as pleased. Two sheets are created and the format is very easy to use. It can also be used with the smart board in the classroom.
Grades:
PreK - 12th
Showing 1-4 of 4 results


