51 results
Graphing resources for Microsoft Publisher
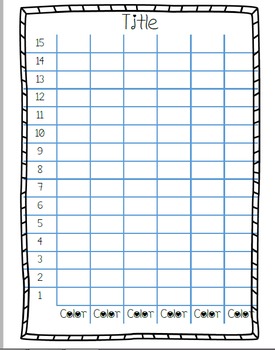
Blank Editable Graphs
These are blank graphs that you can edit by typing in the name of the graph and whatever objects are being graphed. There are bar graphs, a pie graph, and a line graph template.
Subjects:
Grades:
K - 3rd
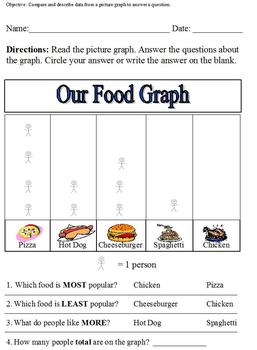
Food Picture Graph; Compare and Describe Data in a Graph
This is modified for sixth grade special ed, statistics. Students will read the graph and answer the questions. This can also be used in primary grades.
Subjects:
Grades:
1st - 6th
Types:
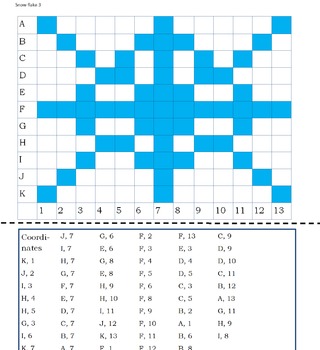
Snowflake Graphing- 4 styles
Snowflake graphing with four styles of snow flakes and three sizes graphs for each. Document made in Microsoft Publisher. Graphs can be sized to own needs/preferences. Each snowflake has an "answer" provided as well. Students can complete the graph using manipulatives (sequins, rhinestones/gems, pony beads, hole punch snowflake, hole punch circles, etc.) glued into given coordinates. Students can also color in the blocks with various colors to form the snowflake using the coordinates. Addi
Subjects:
Grades:
K - 5th
Types:
Quiet Please! A Noise Pollution Activity
Students conduct an activity to determine the most effective way to control noise using shoe boxes and sound-absorbing materials. In groups, students will use one of 8 materials assigned by the teacher to sound-proof the inside of a shoebox. They will place a timer inside the box and test how far away the ringing can be heard, record the results, and then graph the data gathered.
National Science Education Standards: A, B, E, F & G
Subjects:
Grades:
4th - 7th
Types:

Kindergarten Graphing Activity
Students will read a story problem about a student that surveys her class and collects data on each student's favorite ice cream flavor. Students will use the data in the story to create a graph.
Subjects:
Grades:
K - 1st
Types:
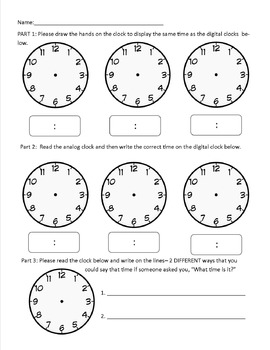
Grade 2 Telling Time Assessment
This assessment was created for my second graders. They need to tell time to 5 minutes intervals, quarter to, quarter past, and half past. The assessment will need to be printed first and then you can fill in the times you would like your students to identify. The assessment includes telling time on an analog clock and then displaying it on a digital clock, and then vice versa. And also writing time in two different ways- such as 2:30 is half past 2 and 30 minutes after 2.
Subjects:
Grades:
1st - 2nd
Types:
Beyond Sand & Water: Sensory and Science Activities for Preschool & Kindergarten
This package is packed with 8 pages of fun sensory and science activities and recipes that are great for Preschool and Kindergarten classrooms. First and second graders would be fascinated by many of these activities as well. Included are some learning extensions and twists on some more classic recipes and experiments. Many of these are great to take outside as well. Several of the activities are fun for all ages!!
Subjects:
Grades:
PreK - 1st
Types:
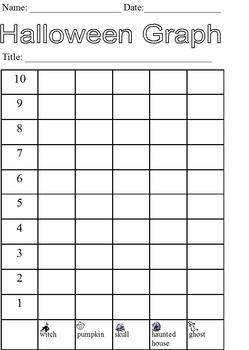
Halloween Graphing With Pictures; Cut and Paste Activity; modified curriculum
This is a three-page activity. The fourth page is all of the pictures that the students will be given by their teacher. These can be cut out individually ahead of time or students can be given a chunk of pictures that they need to cut out. Students should each get 15 pictures to graph.
The first page includes directions:
"Your teacher will give you 15 Halloween pictures to graph. Sort your pictures to put each of the same picture in one pile. Answer the questions on the worksheets and then glu
Subjects:
Grades:
PreK - 12th
Types:
Fruit Loop Math
Here are three worksheets that you can use to graph Fruit Loops! My students loved it and they get a snack at the end:) I hope you enjoy it as well!
Grades:
1st - 3rd
Types:
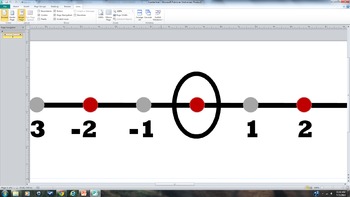
Printable Banner Number Line from -18 to +18 Red, Black and Tan
Printable Banner Number Line from -18 to +18 Red, Black and Tan Print out this Microsoft Publisher File, and you will have your own custom number line! This one is black, red and tan. I made this to fit the decorating needs of my middle school classroom! It will not distract students, but is very visually appealing from anywhere in the room.
Grades:
4th - 12th
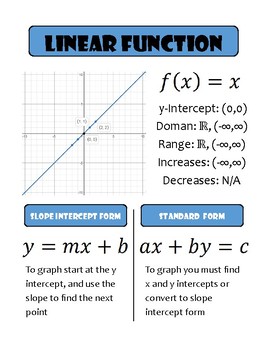
Parent Function Posters (Publisher File)
11 Posters to fill your Algebra 1 and Algebra 2 classroom. Posters include 10 functions: Linear, Exponential, Quadratic, Absolute Value, Linear Piecewise, Radical, Ration, Logarithmic, Cubic (Power Functions), Vertical Line Test, and Transformations. This file the Posters are 8.5 x 11
This is the file on publisher, so if there are things you want to change to fit the needs of your classroom you can.
Poster Size and PDF file versions avaible in my store.
Subjects:
Grades:
9th - 12th
Types:
CCSS:
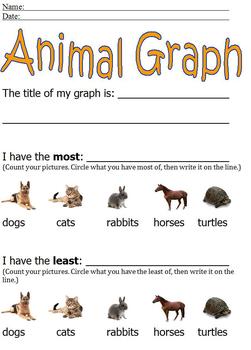
Animal Graphing With Pictures; Simple Cut & Paste; more/less modified curriculum
*****This is the same animal graphing activity found in the animal math packet*****
This is a four-page activity. The third page is all of the pictures that the students will be given by their teacher. These can be cut out individually ahead of time or students can be given a chunk of pictures that they need to cut out. Students should each get 10-15 pictures to graph.
The first page requires students to title their graph, count the pictures to identify most and least, and write in the correc
Subjects:
Grades:
PreK - 12th
Types:
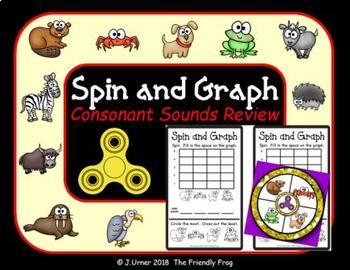
Spin and Graph Consonant Sounds Review
Put your old Fidget Spinners to an educational use. No Fidget Spinner? No worries! Any spinner will work. Or you can use a paper clip and pencil.You will need a Fidget Spinner (or borrow one from a student) and an empty CD jewel case.Place a sticker on one of the prongs of the Fidget Spinner. Then print the spinner cards (laminate for durability) and the accompanying worksheet you wish to have your students practice.The student will use the Fidget Spinner to determine the correct space on the gr
Grades:
K - 2nd
Types:
Also included in: Spin and Graph Bundle
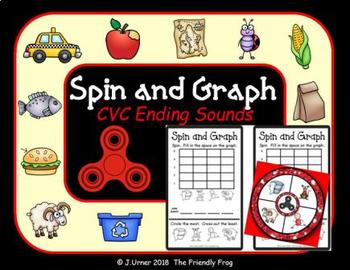
Spin and Graph CVC Ending Sounds
Put your old Fidget Spinners to an educational use. No Fidget Spinner? No worries! Any spinner will work. Or you can use a paper clip and pencil.You will need a Fidget Spinner (or borrow one from a student) and an empty CD jewel case.Place a sticker on one of the prongs of the Fidget Spinner. Then print the spinner cards (laminate for durability) and the accompanying worksheet you wish to have your students practice.The student will use the Fidget Spinner to determine the correct space on the gr

Graphing Project
Students LOVE this activity, and it is a fantastic way to assess their understanding of creating and analyzing data. They will gather their own data and create a frequency table, bar graph, circle graph and data analysis based on their results. This is a perfect way to wrap up a graphing unit and check for understanding at the same time!
Grades:
5th - 6th
Types:
The Country Mouse and the City Mouse Find and Graph
This is a fun math project to pair with the book The Country Mouse and the City Mouse! The math project is finding things related to the book and graphing how many of each is found. This can be used with a Math lesson or as a fun "filler" project!
Grades:
PreK - 3rd
Types:
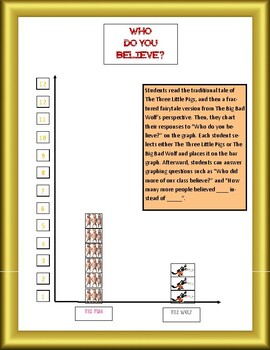
Fractured Fairytale Graphing: Three Little Pigs vs. The Big Bad Wolf
Engage your students in an interactive STEM activity, graphing their opinions on who told the truth, The Three Little Pigs or The Big Bad Wolf!Included: Title QuestionNumbers for measuring each categoryCategory Labels - The Pigs/The WolfThree Little Pigs graphing cardsBig Bad Wolf graphing cardsI would recommend using any copy of The Three Little Pigs traditional tale and either "The True Story of The Three Little Pigs" by Jon Scieszka and Lane Smith or "No Lie, Pigs (And Their Houses) Can Fly!
Subjects:
Grades:
PreK - 2nd
Types:
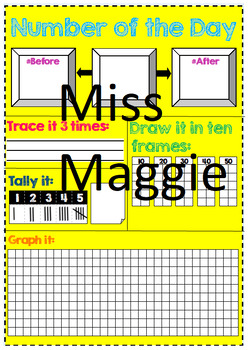
Number of the Day
This is something I use every single day in my classroom so I had to share! Please try it once and you´ll love it. Every day you pick a number and ask your students to pass in front of the class to fill in the blanks.
This poster was created in Publisher for you to print it in a big size!
Grades:
PreK - 4th
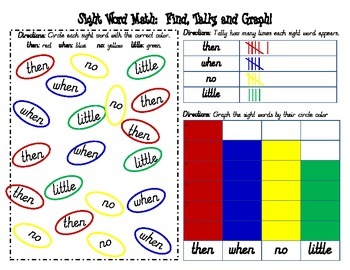
Sight Word Math Activity
This sight word math activity allows learning across curriculum. Students will get practice with identifying sight words as well as math concepts (graphing and tally marks). This document can be edited to fit your personal sight word list. My class uses this document weekly, with the words and the colors being changed to keep my kiddos on their toes!
Grades:
PreK - 1st
Types:
Sorting M&M's by Color
Simple sheet for students to practice sorting M&M's by color and record the correct amount of each group. Perfect for Centers. Easy to use and understand directions.
Subjects:
Grades:
PreK - 1st
Types:
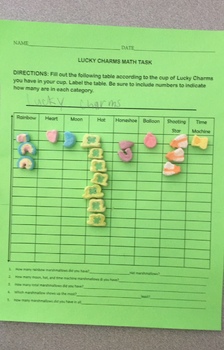
March St. Patrick's Day Math Task Lucky Charms
By using cereal, this math task allows for students to create their own graph,demonstrate most/least, and adding many numbers. Students can do this in groups or individually in a math center. My students love math tasks every Friday.
Subjects:
Grades:
K - 3rd
Types:
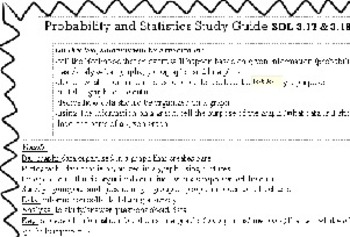
Graphing & Probability Study Guide
This is a study guide that I recently gave my students to help them study for their unit test on graphs and probability. This study guide gives the definitions of: bar graph, pictograph, line plot, survey, data, analyze, key, and probability. Then it has sample problems dealing with the 3 graphs (line plot, picto, and bar) and a few dealing with probability (certain, likely, unlikely, as likely as/equally likely, and impossible).
I have left the study guide in the publisher format in case you w
Subjects:
Grades:
1st - 5th
Types:
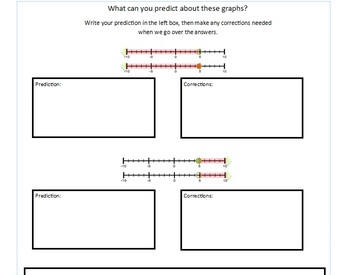
Graphing Inequalities Interactive Notes
These interactive notes are great for introducing graphing inequalities to your students. There are two pages that begin with predictions, go into teacher directed work, and end with independent work.
Subjects:
Grades:
5th - 6th
Types:
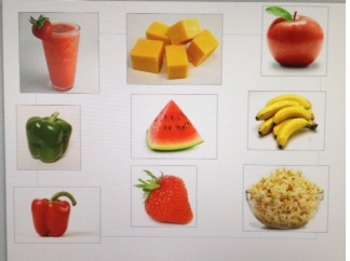
Healthy Food Clip Art
Clip Art of many types of healthy food great for sorting and graphing.
Subjects:
Grades:
PreK - 1st
Types:
Showing 1-24 of 51 results


