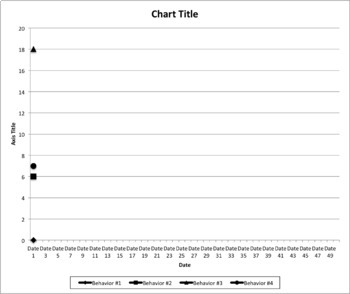
Excel Graphing Template for ABA
Description
Use this Excel template to create a line graph in proper ABA format for behavioral data. An example of a graph is provided in this template. You may graph up to 4 behaviors at a time.
To use:
1. Open the Excel file
2. Fill in the 4 behaviors you would like to graph at the top (to replace Beh #1, Beh #2, etc)
3. Fill in the dates you have data for (this graph is designed to hold 50 days worth of data)
4. Fill in your behavioral data in the columns for each behavior
5. Watch your graph change as you type!
6. PLEASE NOTE: To delete dates that you don't need, click the chart in the upper left hand corner. This should select your data. Drag the corner of the blue box (that's highlighting all the data) to include only the data set you want. This also applies to deleting or adding a behavior at the top. The blue box will graph everything it contains.
7. Don't forget to save your work! Click "Save as" and name your file.


