3 results
Graphing research for Microsoft Excel

Weather Tracking in Excel
Compatible with Google Sheets, Google Classroom, or as a stand-alone file on a PC, this product is a must have for any teacher comparing weather conditions in multiple locations!
BEFORE YOU BUY: This file is part of a larger unit. Save yourself money by purchasing the Super Science Set for Weather and Climate nstead of buying each file separately.
Purchased alone, you get:
⭐ An Excel workbook that enables students to track the weather for 5 different locations as a whole class or individ
Subjects:
Grades:
4th - 8th
Types:

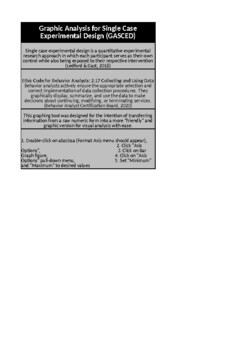
Graphic Analysis for Single Case Experimental Design (GASCED)
This graphing tool was designed for the intention of transferring information from a raw numeric form into a more "friendly" and graphic version for visual analysis with ease. While this tool can be used for single case research design, it can also be used for IEP data. It is important for all special educators to a) take data & b) present that data in a way that everyone can understand. This tool can help with IEP compliance.
Grades:
Not Grade Specific

Duckweed Independent vs Dependent Growth Experiment and Paper
This is a fun lab experiment that I do with my sophomore biology students during our ecology unit. The students each have their own samples of duckweed (Lemna minor) and collect data over 2-3 weeks. They write a scientific paper afterwards. I have included basic lab instructions, student paper instructions, a spreadsheet that the students can put their collected data into, and a grading rubric. Edit the documents as needed for your class.
Grades:
10th - 12th, Higher Education
Types:
NGSS:
HS-LS2-1
Showing 1-3 of 3 results


