53 results
Free graphing resources for Microsoft Excel
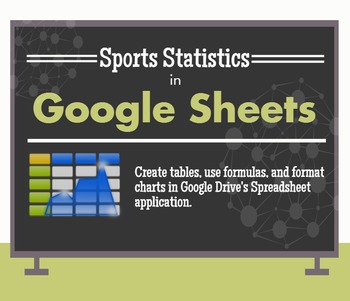
Manage Sports Statistics in Google Drive / Google Sheets - Activity
Use Google Sheets to analyze sports data
This activity lets students practice several fundamental spreadsheet skills, including:
-renaming documents
-adding formulas
-inserting / formatting charts
Screenshots demonstrate how to do all of the above in Google Sheets, the spreadsheet application in the Google Drive suite. You can add additional statistics to customize the assignment for your students and adjust the level of difficulty.
Aligned to the following Massachusetts Technology Literacy
Grades:
5th - 8th
Types:
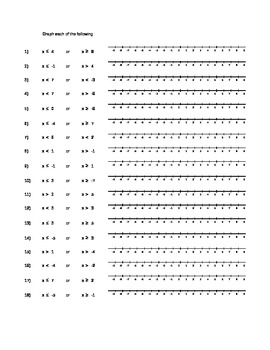
Compound Inequality Graphing Practice
This excel spreadsheet includes a sheet of practice for both AND and OR compound inequalities. There are also three sheets of blank number lines, so that a teacher could write their own inequalities for students to graph.
Grades:
5th - 9th
Types:
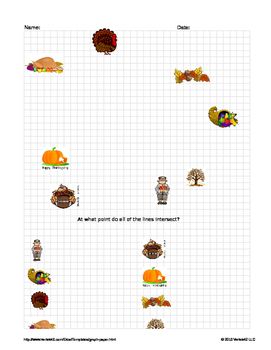
Point-Slope Form Turkey Hunt (Thanksgiving)
use this activity with your students to practice Point-Slope form. Worksheet comes as an excel file with different options. You can have students draw given lines that hit each of the graphics on graph and find the intersecting point OR have students create their own lines that hit each of the graphics and write an equation for those lines.
This is a quickly put together activity, I will go back and edit it for beauty and glamour over the break weekend :)
Grades:
8th - 12th
Types:
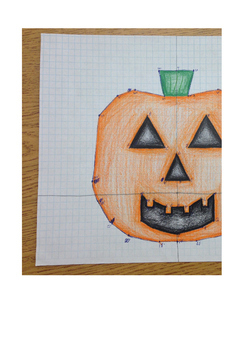
Pumpkin Transformations
This is a fun, artistic activity involving graphing on the coordinate plane, translations, and reflections. It is a great activity after translations and reflections have been taught, and best for doing in the
fall as the outcome is a pumpkin.
It could also be used as an assessment.
Materials needed: pencil, graph paper, crayons/markers/colored pencils.
Grades:
7th - 9th
Types:
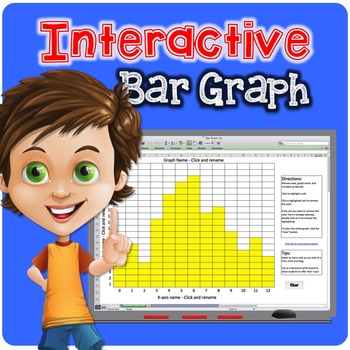
Interactive Bar Graph or Histogram
Brand New! FREE! Graphing has never been so fun! Perfect for Smart Board or Promethean Board graphing! Simply click on a cell to highlight it. Click again to un-highlight it, or press clear to remove all of the input! Use over and over again!
Completely customizable. Change the x- and y-axes names as well as the bar graph name and even the numbers lining the axes. Create bar graphs or histograms depending on how you customize it!
Please note, this is a Microsoft Excel file. In order to use thi
Grades:
Not Grade Specific

Rapunzel Coordinate Plane Picture
Students will graph the ordered pairs and connect them to create a Rapunzel picture. Uses all 4 quadrants on the coordinate plane. Can be used as an extra credit project or a way to practice graphing ordered pairs.
Subjects:
Grades:
6th - 8th
Types:
CCSS:

Solving Systems by Graphing - Google Sheet
16 solving systems problems on a Google Sheet. The Sheet is conditionally formatted so the box containing the answer will turn green and make grading effortless. Both Slope-Intercept Form and Standard Form equations are used.
There is no graph paper attached, my classes do their work on whiteboard graphs.
Be sure to make a copy of the Sheet and put it in your drive so you can edit it if needed.
Want more on Systems?
Solving Systems by Substitution
Solving Systems by Elimination
Chapter Bund
Subjects:
Grades:
8th - 11th
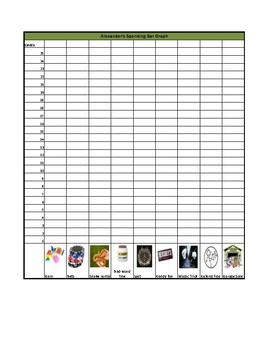
Alexander, Who Used to Be Rich Last Sunday Bar Graph
This is great companion to the story Alexander, Who Used to Be Rich Last Sunday. Students are able to develop a bar graph by shading in the number of cents spent on each item. The bar graph also includes pictures of each item to help those students who need visual representation. At the end of this activity, students will have a visual representation of all the money spent by Alexander. They will be able to use this worksheet to answer the following questions: What item did Alexander spent t
Grades:
Not Grade Specific
Types:
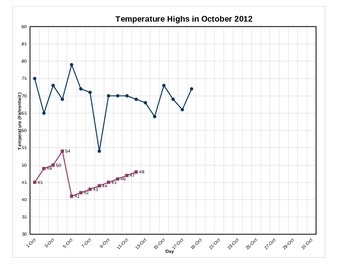
Graph Daily High and Low Temperatures - with handout
Per a few requests, I have added the capability to graph the low temperatures as well as the high temperatures.
Type in the daily temperature on your computer with your students and it will automatically graph it for you as you type. You can pre-print the monthly graph for everyone in your class and they can follow along and graph with you. I use it with calendar math or other daily activities.
Great for explaining the scales of a graph and practicing accuracy in graphing and using rulers t
Subjects:
Grades:
4th - 7th
Types:
Computer Graphing for K-1 "How Many Leprechauns?" for MS Excel
Ready for a fun and instructional activity for St. Patrick's Day? This high interest activity is the perfect thing for the Technology/Computer Lab teacher or the regular classroom teacher to keep their students' attention while they are dreaming of pots of gold! Your kids will sort and count pictures of leprechauns and record their data as tally marks and/or written numbers. After they finish sorting and counting, they will enter their data into a prepared spreadsheet and generate a super cut
Grades:
PreK - 2nd
Types:
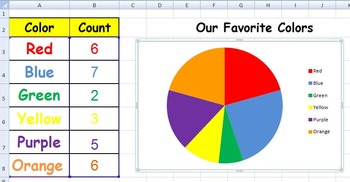
Graph Our Favorite Colors
This Excel spreadsheet will show your primary students the same data in a pie graph, a bar graph, and a line graph. You just need to survey your students about their favorite color and input the numbers into the graph. (When you first look at the graph, no data will be shown.)This spreadsheet offers more graphs:Primary Graphs Unit
Subjects:
Grades:
K - 2nd
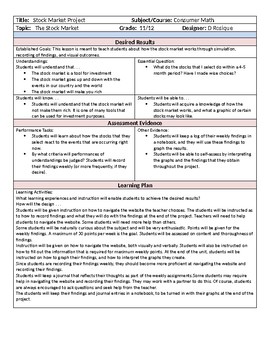
Stock Market Project plus Graphing and Data Recording
This is a project that I use in my classroom to teach students how the stock market works and what the data looks like after a period of at least three months. Students record data findings weekly, and after a period of at least twelve weeks, the graph their findings. This is useful in illustrating how the stock market goes up and down with the events that are happening throughout the world.
Subjects:
Grades:
11th - 12th
Types:
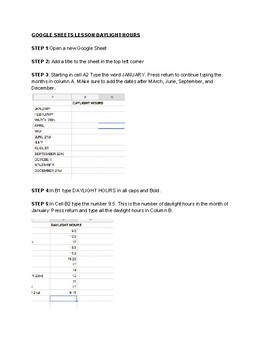
Google Sheets Beginner Lesson
This activity will give students an understanding of basic Google Sheets functions such as, adding data to cells and inserting a chart based on the data. Great for beginners!
Subjects:
Grades:
3rd - 5th
Types:
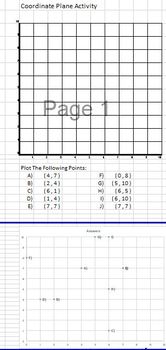
5th Grade Coordinate Plane Worksheet Generator
This Excel Product Randomly generates coordinate plane worksheets with 10 points intended for bell work. They points lie between 0 and 10 and one sheet is for whole numbers, another for half, and another for tenths. Answer keys are included. Whenever a new entry in any cell is made, the workbook refreshes with all new questions and answer keys.
Also uses a code key that chooses 10 five letter words from a list of 500 to encode on coordinate plane type code.
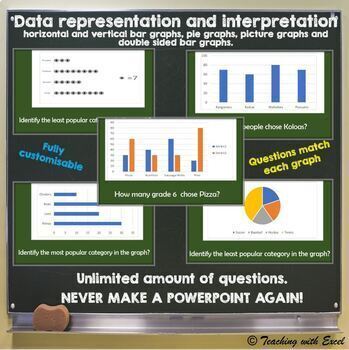
Data representation and interpretation - With Answers UNLIMITED QUESTIONS
Get your students engaged and save yourself time while practicing Data representation and interpretation. Data and Graphing unlimited questions with answers can be used for revision, concept practice, game questions, warmups and many other areas. No more hours prepping slideshows that will only last 5 minutes, this sheet can do it for you when you Simply Click. With little to no effort you have the control to enter the types of data representation and interpretation questions would like to see
Grades:
3rd - 8th
Also included in: Year 6 Maths Bundle Unlimited Questions
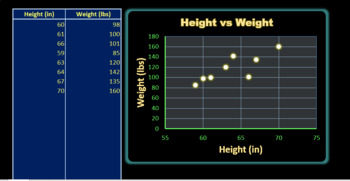
Interactive Excel Scatter Plot Maker - Editable
With this document, you can create scatter plots in real time with your class. The file uses Microsoft Excel's graphing ability to make a scatter plot. All you have to do is name the axes, add data (up to 500 pairs of numbers), and then name your graph. The file is editable in Excel and can be altered in any desired way (colors, format, etc.). To name the axes, edit the title at the top of the data table and the graph will automatically update.To name the graph, double click "[Title]" and enter
Grades:
4th - 10th
Types:

Finding Slope From an Equation
10 equations are given in slope intercept form for students to identify the slope.Self-Grading, the answers will turn green/blue if they are correct. You only have to look at the thumbnails in Google Classroom to see they are correct.To see the correct answers, you can go to format - conditional format. I would not do this around your students, or they will see how they can cheat.
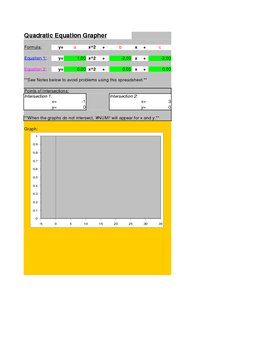
Quadratic Grapher
Quadratic Grapher MS Excel Spreadsheet graphs up to 2 quadratic equations / functions at a time. It is color coded so it is easy to see which parabola corresponds to which equation.
It also displays 10 points. The x values can be changed to your liking.
It also finds the points of intersection between the two parabolas. This is useful for solving a system of two quadratic equations. It could probably even solve a system of two equations that has one quadratic and linear equation. Just inp
Grades:
9th - 12th, Higher Education
Types:
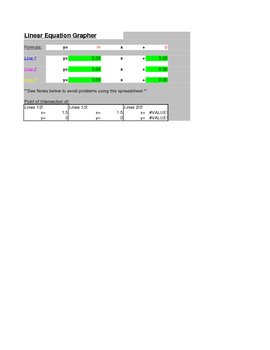
Linear Grapher
Linear Grapher Microsoft Excel Spreadsheet that allows you to graph up to 3 lines at a time. The lines are color coded with the equations, so you will know which line corresponds to which equation.
It also displays 10 points for each equation. The x values for these points can be adjusted.
It also finds the points of intersection for every pair of lines. This is helpful for system of equations.
It also has a seperate application built into the spreadsheet for finding the equation of a line
Grades:
8th - 12th, Higher Education
Types:
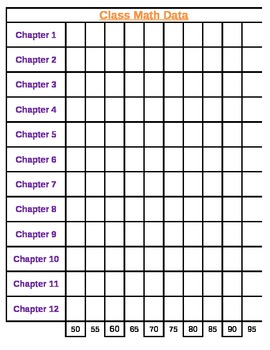
Math Class Data Sheet
Great for a class Data Wall!
This is an excel spreadsheet used to track yearly growth.
Enjoy!
Subjects:
Grades:
K - 12th
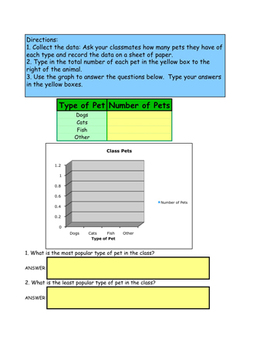
Class Pets: Collecting Data and Reading Graphs in Excel for Primary Grades
Save this file to a shared drive so that all students can access it on their own computer. This file contains two pages in Microsoft Excel. The tabs at the bottom allow you to click back and forth between the two pages. For each student in your class, print a copy of the Data Collection sheet. Give students time to survey their classmates and record the data on the collection sheet. Students will enter the data into the spreadsheet which will automatically create a graph on the page. Students wi
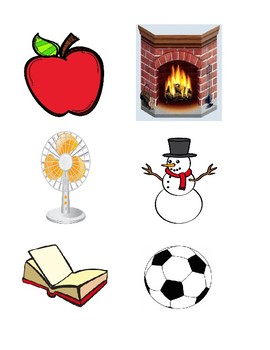
Fire Safety - Hot or Not?
This is meant to be used as pictures for a circle time graph labeled 'Hot or Not'.

Using Spreadsheets to Investigate Candy Color and Size Distribution
Hi Teachers! In this project, students practice with entering and formatting candy size and color data, making basic spreadsheet formulas, and using the SUM, AVERAGE, and COUNTIF functions. Students may also practice making 2D or 3D pie charts based on the %s of sizes of candies, and the %s of colors of the candies. Material expenses include a bulk bag of small Wonka Nerds boxes, small Ziploc-style baggies, and Sharpies. This could be modified to involve only color data of other candies, such as
Grades:
4th - 7th
Free Tree Measurement Data
Teaching circumference and diameter conversions? Teaching graphing or data literacy? Here is dataset of 50 trees you can use to explore! Excel file includes #, diameter of tree, and whether it is a deciduous or coniferous. It's an easy way to use real science data in the classroom. Goes great with Tree Measuring Lab.
Subjects:
Grades:
6th - 10th
Showing 1-24 of 53 results


