10 results
Graphing resources for Microsoft Excel $10 and up
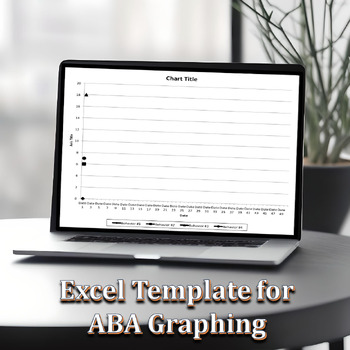
Excel Graphing Template for ABA
Use this Excel template to create a line graph in proper ABA format for behavioral data. An example of a graph is provided in this template. You may graph up to 4 behaviors at a time. To use: 1. Open the Excel file2. Fill in the 4 behaviors you would like to graph at the top (to replace Beh #1, Beh #2, etc)3. Fill in the dates you have data for (this graph is designed to hold 50 days worth of data)4. Fill in your behavioral data in the columns for each behavior5. Watch your graph change as you t
Subjects:
Grades:
Staff
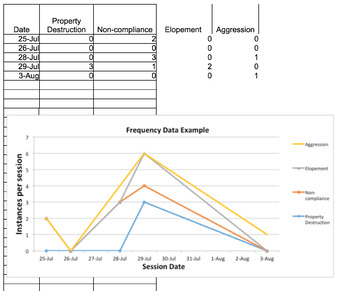
Graphing Basic Applied Behavior Analysis Data
This is a great resource for students or teachers that are new to learning how to graph frequency data (e.g., instances of aggression), accuracy data (e.g., % of correct sight words), baseline and treatment data, along with a few more. Each tab contains an example of data that is entered, as well as a (labeled) graph to accompany that data. It is very easy to edit and can be used to graph a multitude of different types of data. It is also a wonderful resource for therapists and other clinicians
Subjects:
Grades:
Not Grade Specific
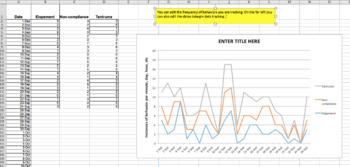
More Graphs Added! Graphing Basic Data For Students: An Excel Workbook
This is a great resource to use for data tracking for all of your students or clients. I have expanded the other Graphic Workbook on my TPT store. This resource is made to easily create graphs for a variety of skills or behaviors. As a result, this excel workbook can be used by teachers, behavior analysts, speech therapists, behavior intervention specialists, really anyone who needs data collection. The graphs can be shared during parent-teacher conferences, IEP meetings, included in student pro
Subjects:
Grades:
Not Grade Specific
Types:

Parabola Transformations - Interactive
A handy guide to help new students learn how each change affects the shape and direction of parabolas. Clear color coding for the various pieces of the formula and instant updates help separate and isolate the concepts for easy, intuitive learning.Enter information using simple dropdown menus and organized blank fields to isolate each piece of the formula!Two tabs:One allows you to enter individual pieces of information to show the resulting formulaOne allows you to enter the formula to show the
Subjects:
Grades:
7th - 12th, Higher Education, Adult Education
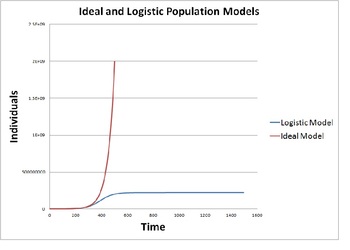
Modeling Population Growth (Ideal vs. Logistic Model)
This activity provides instructions to construct a mathematical model on a blank spreadsheet that simulates population growth using an ideal model and a logistic model. The activity provides background discussion and then gives instructions on how to program a spreadsheet to produce and display the ideal and logistic population models. Their results are studied for various cases including human population, rabbits, polar bears, bacterial and yeast colonies.
This quantitative population model
Subjects:
Grades:
9th - 12th, Staff
Types:
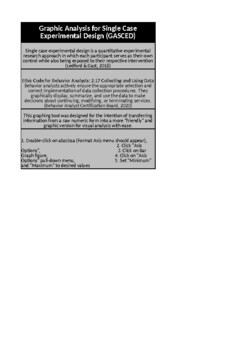
Graphic Analysis for Single Case Experimental Design (GASCED)
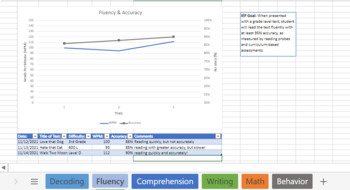
This graphing tool was designed for the intention of transferring information from a raw numeric form into a more "friendly" and graphic version for visual analysis with ease. While this tool can be used for single case research design, it can also be used for IEP data. It is important for all special educators to a) take data & b) present that data in a way that everyone can understand. This tool can help with IEP compliance.
Grades:
Not Grade Specific
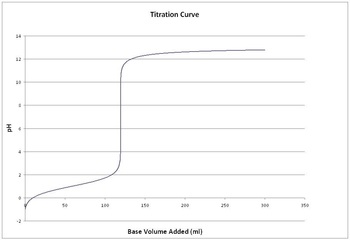
Simulating Titration of Acid on a Spreadsheet
This activity guides students to construct a spreadsheet from a blank Excel workbook that will simulate titration of acids or bases.
*Teacher background on Excel is not required*
After constructing the spreadsheet and graphs the students will experiment with the spreadsheet to answer analysis questions that will help students learn the mathematical nature of titration (solutions are provided including descriptions of all spreadsheet manipulations necessary to solve each problem).
The va
Subjects:
Grades:
10th - 12th, Higher Education
Types:
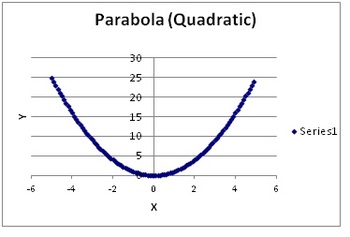
Graphing and Analyzing Functions on a Spreadsheet
This math activity allows students to investigate the behavior of functions (Quadratic, Cubic, Hyperbolic and Exponential) by adjusting the domain over which the functions are viewed. Students are guided with step by step instructions on how to program a blank spreadsheet to graph functions of their choosing over intervals that they specify. Graphs are manipulated and students are guided to look at growth rates of functions and how they behave as they approach larger and smaller values. Real
Subjects:
Grades:
10th - 12th
Types:
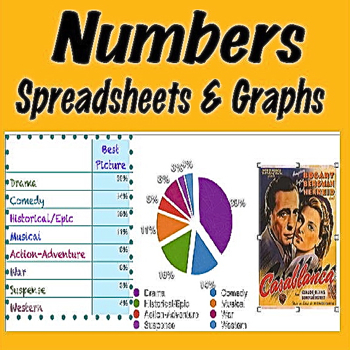
Numbers Spreadsheets and Graphs
The skills needed to create spreadsheets and graphs will stand students in good stead from junior high school through college and into their professional lives as adults. Start in 7th grade to teach your students how to create these data and math skills with Apple’s program called Numbers. And although, the assignments provided in this unit are written to take advantage of the tools available in Numbers, if you’re a Microsoft user, the ideas can be easily converted to Excel spreadsheets and g
Subjects:
Grades:
7th - 9th
Types:
IEP Data Bundle
This bundle has it all! The IEP data sheet template is a printable resource that helps you keep a student's IEP goals and data all in one place! Just copy and paste your IEP goals or objectives in the space provided, print, and use to gather progress monitoring data. Take your data to the next level by uploading the data to an online spreadsheet. When used together, these data-driven products allow you to monitor progress on IEP goals and objectives, upload your data into a digital format an
Grades:
Not Grade Specific
Types:
Showing 1-10 of 10 results


