368 results
Problem solving graphing resources for Microsoft Excel
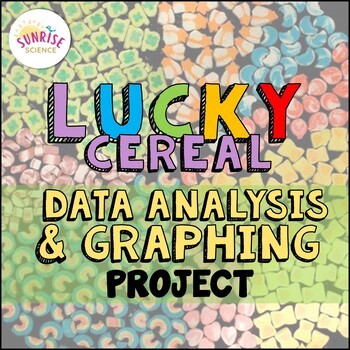
Lucky Charms Cereal Data Analysis and Graphing Project St. Patrick's Day
Looking for a way to review data analysis and graphing skills without it being a bore? This Lucky Charms Cereal Data Analysis and Graphing Project is a fun activity to incorporate in March for St. Patrick's Day, but of course it works at any time of the year in a graphing unit or in a math-integrated unit. Your students will smile when you whip out the box of Lucky Charms and tell them that they are to pretend they are the Quality Control Department at the Cereal Company! This activity is fun an
Subjects:
Grades:
6th - 8th
Types:
NGSS:
MS-ETS1-4
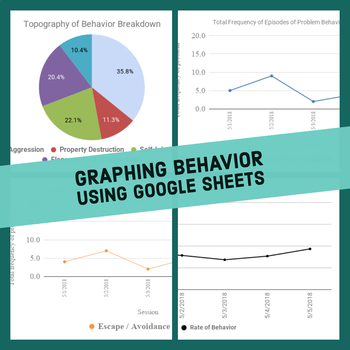
ABA Behavior Graph Excel Workbook
You do not need to purchase multiple licenses; feel free to use with as many clients as you want.Note: Email me at ian.vignes@atlasautismcenter.com for a link to the google sheets version, once you've made your purchase.Description: This file graphs behavior data for a single client. In it's current format, it records frequency and rate of behavior, as well as frequency of function of behavior. In addition, there is a pie chart breakdown of the percentage of each topography of behavior. For an
Grades:
Staff
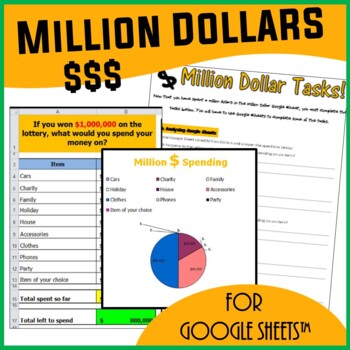
Spreadsheets Activity for Google Sheets™ - Million Dollars Scenario
Students use this fun Google Sheets spreadsheet activity to understand how altering data in Google Sheets allow graphs to change. They understand such concepts by trying to spend a Million Dollars in a minute. This resource allows students to understand the following: How graphs change when data in Google Sheets is alteredUse of SUM() functionsHow graphs are madeComponents of a graphAdvantages of spreadsheets over pen and paper methodsStudents are then expected to complete the associated workshe
Grades:
Not Grade Specific
Types:
Also included in: Technology Lessons Activities & Skills Building Bundle for Google Drive™
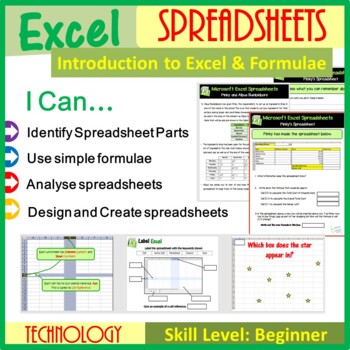
Excel Spreadsheet activities (Introduction to Spreadsheets & Calculations)
This fun spreadsheet activity lesson introduces the very basics of Microsoft Excel such as its different features, keywords as well as how to create basic calculations. Once students have developed their initial skills in how to use Excel, they will be expected to design and create their own spreadsheet based on a given scenario. This resource has been trailed and tested in the classroom and is a proven success. This lesson comes with: Selection of Worksheets including Answer KeysMini TestsDetai
Grades:
Not Grade Specific
Types:
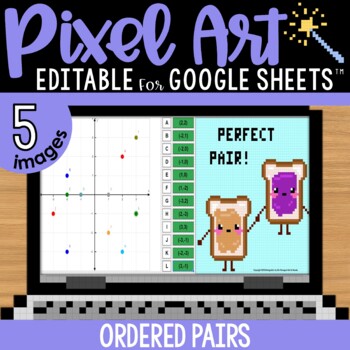
Ordered Pairs Graphing Coordinate Plane Pixel Art Math | 5 Images | Editable
Ordered pairs mystery pixel art with a doubles / perfect pairs theme! Have students practice finding the location of a coordinate pair on a graph to AUTO-GENERATE one of 5 pixel art images in Google™ Sheets (or Microsoft Excel™) plus a "secret message."★ Low Prep: Just assign the sheet in Google Classroom. Each sheet includes all 5 images; students click the tabs at the bottom to advance to the next pixel image. There are 12 math problems per image to solve.★ Differentiated: Includes 4 versions
Grades:
4th - 5th
Types:
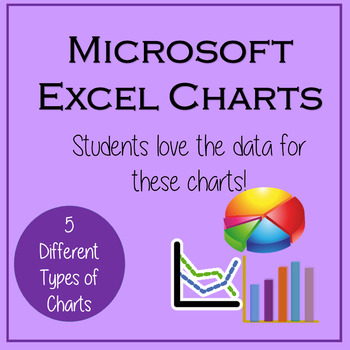
Excel Lessons - Creating Charts
No Prep! These lessons are great as a first Excel Chart lesson or for students already a little familiar with creating charts. Students love the data for these charts because the data is centered around things they love – their cell phones! In Lesson 1, students will create 5 different charts from step-by-step directions which include Chart Titles, Chart Styles, Axis Titles, Data Labels, and Moving Chart to its own Sheet.In Lesson 2, students will create 5 charts from provided data as well as ch
Grades:
5th - 12th
Types:
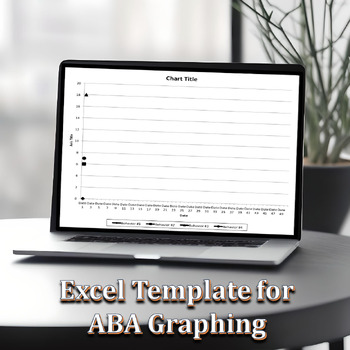
Excel Graphing Template for ABA
Use this Excel template to create a line graph in proper ABA format for behavioral data. An example of a graph is provided in this template. You may graph up to 4 behaviors at a time. To use: 1. Open the Excel file2. Fill in the 4 behaviors you would like to graph at the top (to replace Beh #1, Beh #2, etc)3. Fill in the dates you have data for (this graph is designed to hold 50 days worth of data)4. Fill in your behavioral data in the columns for each behavior5. Watch your graph change as you t
Subjects:
Grades:
Staff
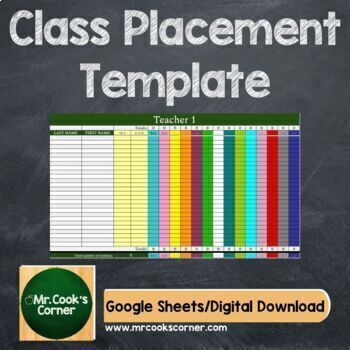
Class Placement Digital Excel Template (Google Sheets)
Thank you for choosing Mr. Cook’s Corner! ⬆⬆⬆⬆Check out the preview pics for a detailed glimpse of this product!⬆⬆⬆⬆✨This digital product comes with free updates for life! ✨Easily create your class lists/rosters online with this Class Placement Digital Excel Template! You can project this file on your overhead, or screen share the file on a Zoom/Meet call in order to better collaborate with teammates, staff, and administrators.Here are the specifics of this particular product:➜Determine your own
Subjects:
Grades:
Staff
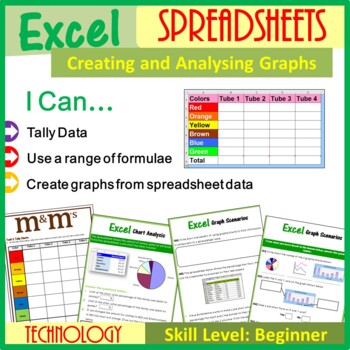
Excel Spreadsheets – Creating & Analyzing Graphs
This lesson encourages students to tally a number of different colored m&ms from 4 different packs (displayed on a PowerPoint to aid visual learners). Students then use this data to create a spreadsheet and go on to create 4 different graphs. Students are then expected to answer graphs related questions in order for them to think in detail as well as solve problems. This lesson can be extended further to meet the needs of fast learners/Gifted & Talented students. The resources for this l
Grades:
Not Grade Specific
Types:
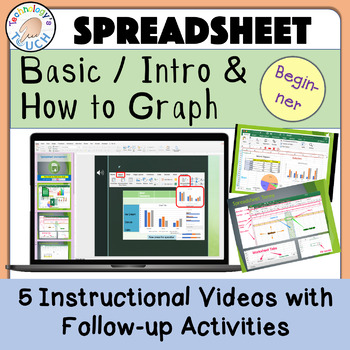
Spreadsheet - Basics Introduction & Graphing (Excel and Google Sheets)
This lesson guides students via animation and a tutorial video before completing the assignments. This is completely paperless with no prep, and lessons are done on either Microsoft Excel or Google Sheets. Students learn to enter data and start graphing. This resource is intended for learners first starting out or those who need a reminder on using spreadsheets or creating graphs. If you want your students' research papers to include eye-catching graphs, give this lesson a try. Start the slides
Subjects:
Grades:
1st - 8th
Types:
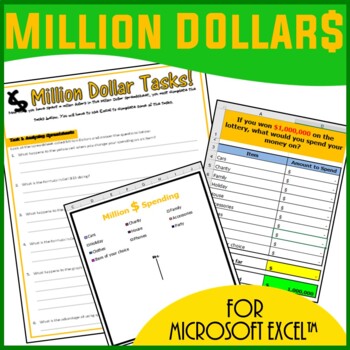
Excel Spreadsheets Million Dollars Activity
This resource allows students to understand the following: How graphs change when spreadsheet data is alteredUse of SUM() functionsHow graphs are madeComponents of a graphAdvantages of spreadsheets over pen and paper methodsStudents use this resource to understand how altering data in spreadsheets allow graphs to change. They understand such concepts by trying to spend a Million Dollars in a minute. Students are then expected to complete the associated worksheet which accompanies the spreadsheet
Grades:
5th - 12th, Adult Education
Types:
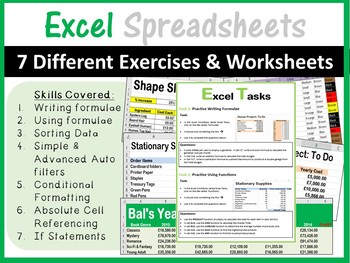
Microsoft Excel Spreadsheets Activities & Worksheets
This is a very informative resource (suitable for beginners and intermediate users of Excel) which comes complete with 7 EXCEL SPREADSHEETS, an EXCEL LESSON BOOK, Lesson Tasks and Step-by-Step instructions. The following topics are included in this resource: • Simple Formulae• Simple Functions – Sum, Average, Min, Max• Simple & Custom Sorts• Simple & Advanced Filters• Conditional Formatting • Absolute Cell Referencing • If StatementThis has been trialed and tested in the classroom and re
Grades:
Not Grade Specific
Types:
Also included in: Microsoft Excel Spreadsheets Lesson Plans Bundle - Computer Applications
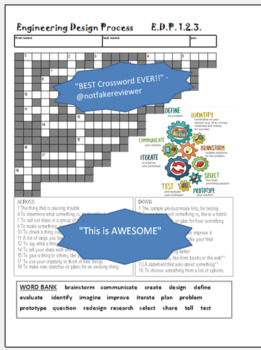
Engineering Design Process - CROSSWORD PUZZLE #2 STEM -Problem Solving -20 Clues
This 20 Clue Crossword puzzle covers the basics of the EDP steps. The answers can be found on the EDP graphic right there on the page!! Word bank & KEY included. SAMPLE CLUES:1 The thing that is causing trouble 4 To determine what something is, to describe it 7 To call out ideas in a group of people 9 To make something, especially something new. 10 To check a thing out, to see if it works right 11 A list of steps you decide on so you can reach a goalThe complete Word Bank:brainstorm
Subjects:
Grades:
7th - 9th
Types:
Also included in: STEM / Engineering Design Process BUNDLE
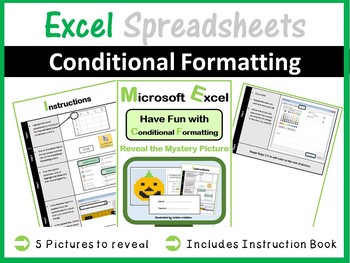
Microsoft Excel Spreadsheets - Conditional Formatting (Pixel Art)
Teach your students how to use Conditional Formatting in Microsoft Excel in a fun way. Students have to reveal 5 different mystery pictures by using Conditional Formatting. This resource comes complete with an instruction booklet.Other Microsoft Excel Products Available:• Microsoft Excel Bundle 1: Click Here• Microsoft Excel Bundle 2: Click Here• Grades 1- 4: Microsoft Excel The Bundle: Click Here• Excel Spreadsheets - Lesson Book & 7 Different Spreadsheets: Click Here• Introduction to Excel
Grades:
Not Grade Specific
Types:
Also included in: Microsoft Excel Spreadsheets Lesson Plans Bundle - Computer Applications
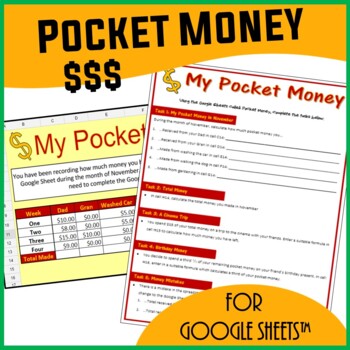
Spreadsheets Activity for Google Sheets™ - My Pocket Money
A fun Google Sheets spreadsheet activity which tests students’ knowledge on the following spreadsheet skills: Cell referencingSimple formulae/calculations such as addition, subtraction, multiplication and division. Sum() function Making predictions by changing dataStudents are expected to complete the associated worksheet which accompanies the Google Sheet. This resource includes a Google Sheet file (accessed via a link) and a 2 page PDF Worksheet (printable)❁❁ Click Here to Follow MeBenefits fo
Grades:
Not Grade Specific
Types:
Also included in: Technology Lessons Activities & Skills Building Bundle for Google Drive™
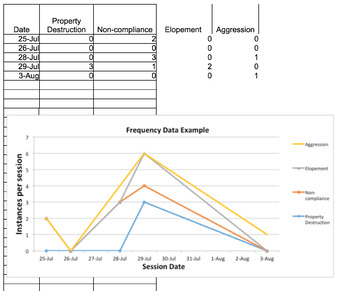
Graphing Basic Applied Behavior Analysis Data
This is a great resource for students or teachers that are new to learning how to graph frequency data (e.g., instances of aggression), accuracy data (e.g., % of correct sight words), baseline and treatment data, along with a few more. Each tab contains an example of data that is entered, as well as a (labeled) graph to accompany that data. It is very easy to edit and can be used to graph a multitude of different types of data. It is also a wonderful resource for therapists and other clinicians
Subjects:
Grades:
Not Grade Specific
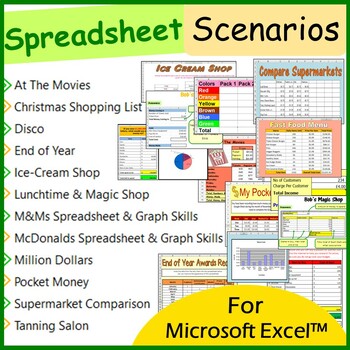
Spreadsheet Scenarios and Activities Bundle for Microsoft Excel ™
The exercises in this bundle are perfect to allow students to practice their skills in Microsoft Excel. It assumes that students have some prior knowledge in using Excel, thus these prove to be excellent resources for consolidation work or even mini tests. Using each of the resources in this bundle is sufficient for 1 months worth of teaching material. Please bear in mind that some of the spreadsheet activities will take longer to complete than other spreadsheet activities. This bundle includes
Grades:
Not Grade Specific
Types:
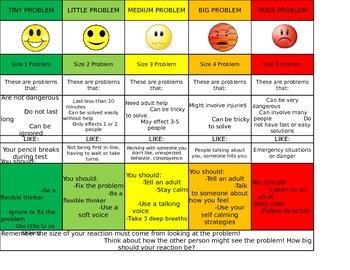
Size of the Problem Visual with Supports
This visual uses color, illustrations and words to identify problem size, a situation example, and suggestions how to respond with suggestions for sensory and behavioral strategies.
This visual is packed so feel free to modify it for your younger students or for students that may not benefit from all the verbal information.
When printing, be sure to decrease margins to zero so that the visual fits on one page.
Grades:
K - 5th
Types:
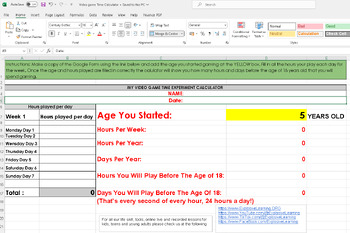
Screen Time Calculator or Video Game Time Calculator Excel sheet
Discover the power of time management with our "Video Game Time Experiment Calculator"! This interactive Excel tool is perfect for educators and parents looking to provide a practical lesson on screen time awareness. With a user-friendly interface, the calculator allows users to input the age they began playing video games and track the hours spent gaming each day. By projecting these figures up to the age of 18, it offers an eye-opening forecast on the total time dedicated to gaming, emphasizin
Subjects:
Grades:
4th - 12th, Higher Education, Adult Education, Staff
Types:
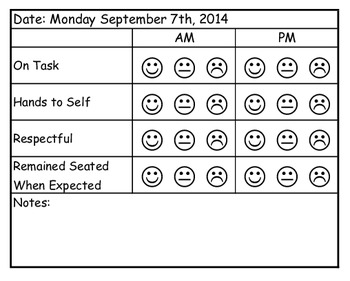
Behavior Tracking Form (Editable)
Use this quarter sheet behavior tracking form that to track four areas of behavior you select. This form is split into AM and PM so students have the opportunity to restart behavior expectations after lunch with a clean slate. This is a quick simple form for teachers to send home information to parents on a daily basis about student behaviors. Fill in the behaviors you wish to track, print on 8 ½” x 11” paper and cut into fourth to save paper. This can be modified for individual students with sp
Subjects:
Grades:
PreK - 5th
Types:
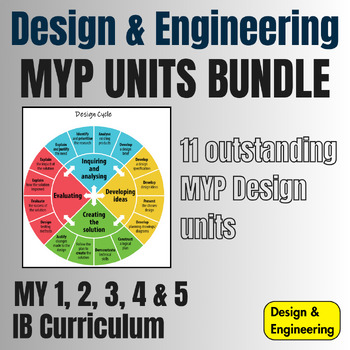
IB MYP Design Units Full Bundle
Full MYP Units Bundle which can cover the entire MYP 1 - 5 Design, representing a significant saving over buying units individually.In these outstanding, creative units, students are tasked with designing and making solutions in line with specific client-led briefs. With practical, written, and theory work closely related to the new MYP Design Specification and four assessment criteria.These units/projects have been designed for a term (12-14 weeks) or half-term (6-8 weeks) though each can be ex
Subjects:
Grades:
8th - 11th

Computer Graphing for K-2 How Many Puppies?
This beginning graphing activity is a great way to differentiate and meet the needs of all your students as they count and sort four different super cute puppies into groups and record their numbers on tally sheets. Students who may struggle can be given fewer types of pictures to sort and/or count, while more advanced students can be challenged with more to count and sort. Once your students enter their data into a prepared spreadsheet, it will automatically create a pictograph!The preformatt
Grades:
K - 2nd
Types:
Microsoft Excel Spreadsheets Ultimate Bundle - Computer Applications
This bundle covers all you will need to teach your students how to use Microsoft Excel with confidence, in a fun way. Below is just an outline of the type of resources included in this bundle: Detailed suggested lesson plansPDF version of PowerPointsStudent Worksheets (PDF Files)Microsoft Excel spreadsheet exercises which can be used as mini tests or for consolidation work.I Can Statements This bundle includes the majority of the Excel resources available on my store, thus allowing you to make a
Grades:
Not Grade Specific
Types:
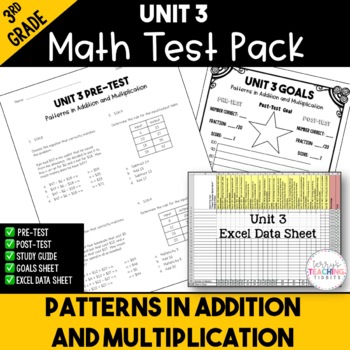
Patterns in Addition and Multiplication Printable Test Pack {3rd Grade Unit 3}
Make assessment administration incredibly easy with this printable test pack.What You Get:a printable pre-and post-test for the unit (20 questions, multiple choice)Excel data sheets to show student growth study guides to help students prepare for the post-testa student goals sheets for your class to track their growth from the beginning of the unit to the endA link to a tutorial video on how to use the Excel data sheetThis test is aligned to the Georgia Standards of Excellence Unit 3: Patterns i
Subjects:
Grades:
3rd
Types:
Also included in: 3rd Grade Printable Math Test Bundle
Showing 1-24 of 368 results


