ABA Behavior Graph Excel Workbook
What educators are saying
Description
You do not need to purchase multiple licenses; feel free to use with as many clients as you want.
Note: Email me at ian.vignes@atlasautismcenter.com for a link to the google sheets version, once you've made your purchase.
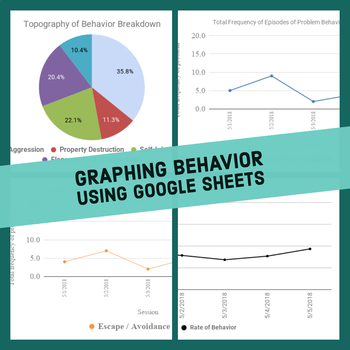
Description: This file graphs behavior data for a single client. In it's current format, it records frequency and rate of behavior, as well as frequency of function of behavior. In addition, there is a pie chart breakdown of the percentage of each topography of behavior. For an in depth video of how the graph works, please visit our youtube page.
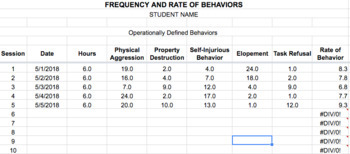
Each Tab: There are 7 total tabs - 2 for data entry (table 1: frequency data by specific behavior & table 2: frequency data by function of behavior). There are 5 graphs!
- Graph 1: Pie Graph (Depicts a breakdown of the total percentage of behaviors recorded)
- Graph 2: Pie Graph (Depicts a breakdown of the total percentage of functions of behaviors recorded)
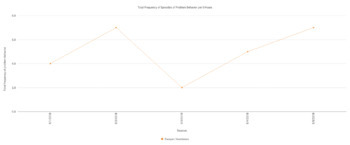
- Graph 3: Line Chart (Depicts the frequency of behavior by hypothesized function by day with all of the functions listed on a single graph)
- Graph 4: Line Chart (Depicts the rate of behavior by day by combining the frequencies of all target behaviors and dividing by the number of hours in that day)
- Graph 5: Line Chart (Depicts the frequency of behavior by target behavior by day, with all of the behaviors listed on a single graph)
Customization to Fit Your Needs: I have these graphs set up for an FBA. But, you can easily change the titles to fit your needs. The format is set up for a single student per file. They can contain an infinite number of data points, but I recommend starting a new graph after 50 or less data points. A good rule of thumb is to use a graph a quarter.
How I use it: Each client has one of these files in his or her google drive folder. At the end of the day, we transfer our written data into this file. When the file is full, we move it in a folder labeled: old behavior graphs. We then add a new file into their drive and start over. The graphs are designed in such a way that they can be printed on one page.
Troubleshooting: If you have trouble converting the document from excel to google sheets, please contact me and I can send you a link.


