14 results
Graphing resources for Microsoft Excel $5-10
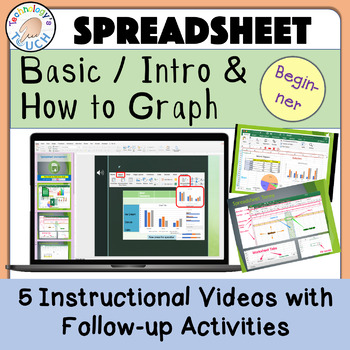
Spreadsheet - Basics Introduction & Graphing (Excel and Google Sheets)
This lesson guides students via animation and a tutorial video before completing the assignments. This is completely paperless with no prep, and lessons are done on either Microsoft Excel or Google Sheets. Students learn to enter data and start graphing. This resource is intended for learners first starting out or those who need a reminder on using spreadsheets or creating graphs. If you want your students' research papers to include eye-catching graphs, give this lesson a try. Start the slides
Subjects:
Grades:
1st - 8th
Types:
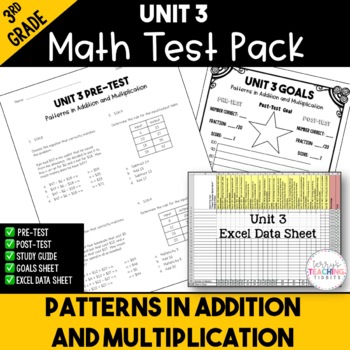
Patterns in Addition and Multiplication Printable Test Pack {3rd Grade Unit 3}
Make assessment administration incredibly easy with this printable test pack.What You Get:a printable pre-and post-test for the unit (20 questions, multiple choice)Excel data sheets to show student growth study guides to help students prepare for the post-testa student goals sheets for your class to track their growth from the beginning of the unit to the endA link to a tutorial video on how to use the Excel data sheetThis test is aligned to the Georgia Standards of Excellence Unit 3: Patterns i
Subjects:
Grades:
3rd
Types:
Also included in: 3rd Grade Printable Math Test Bundle
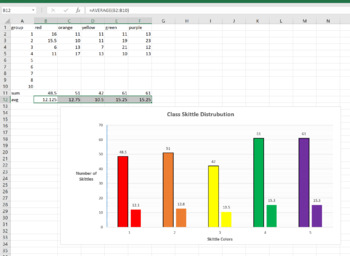
Skittle Statistics MS Excel Mini-Lab
This is a 1 class MS Excel lab for a computer or math class. You can have the students explore the distribution of different color Skittles in class. This is a great mini-lab or half-day activity when you school ends up with a weird schedule day. Tell them they can't eat till the Skittles till the end of class, or they will distort their numbers. Also make sure they don't throw them or shove them up their nose (Yes, stuck Skittles are hard to extract, ask me how I know..)The goal of this lab is
Grades:
6th - 12th, Higher Education, Adult Education
Types:
NGSS:
MS-ETS1-2
, HS-ETS1-2
, HS-ETS1-3
, MS-ETS1-4
, MS-ETS1-1
...
Also included in: Hands-on Science Semester Labs Bundle
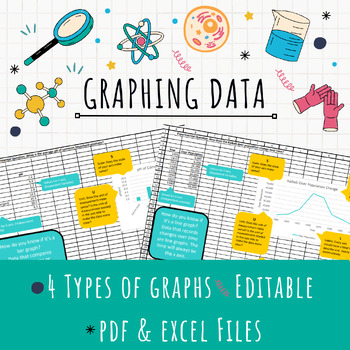
EDITABLE Excel Graphing Template
Teach graphing in Excel with this EDITABLE template! After collecting data, have your students represent it in a formal graph using Excel. This template provides helpful tips for students to determine the right kind of graph (bar, line, or pie) for their data and ALSO teaches them all the important parts of a graph.Assign the template for students to download and edit for a quick graphing solution or provide the pdf handouts for students who just need a little guidance!4 different kinds of graph
Grades:
7th - 12th
Types:
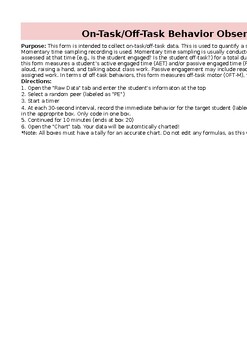
Behavior Observation Academic Engagement and Time on Task (BOSS) AUTO GRAPH
This form is intended to collect on-task/off-task data. It will AUTO graph. This is used to quantify a student's academic engagement and off-task behaviors. Momentary time sampling recording is used. This form measures a student’s active engaged time (AET) and/or passive engaged time (PET). In terms of off-task behaviors, this form measures off-task motor (OFT-M), verbal (OFT-V), and passive behaviors (OFT-P). EXCEL DOCUMENT.
Subjects:
Grades:
Not Grade Specific
Graphed Behavior Data Spreadsheet (Pre-Dated 2023-24 School Year)
Easily Graph student behavior data with this pre-formatted Excel spreadsheet. Simply enter the students' data in the spreadsheet and the document creates a colorful data graph. There is a spreadsheet and data graph pre-populated for each weekday of the 2023-2024 school year.
Subjects:
Grades:
Not Grade Specific
Types:
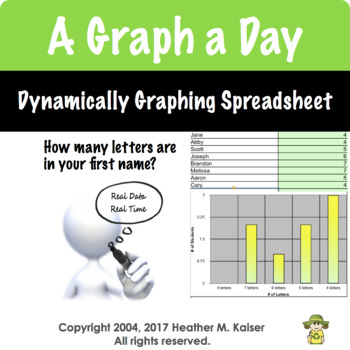
Daily Graph
If you want to integrate technology in a meaningful way, try using the daily graph questions that generate a graph in real time as students respond. This fully editable product works in Numbers, Excel, and Google Sheets.
When downloaded, this Excel spreadsheet contains 180 questions for students to answer. The teacher types their student roster 1 time. As students respond the graph is created dynamically. Teachers can customize the prompts and can upload the file as a Google Sheet that can
Grades:
3rd - 5th
Types:
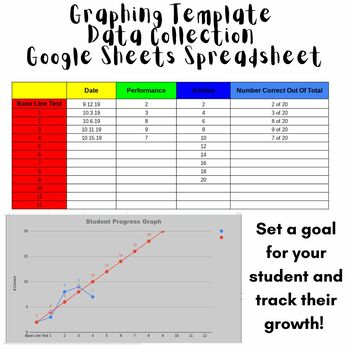
Data Collection Graph Template - Great for IEP GOALS!
Organize your data for students GOALS! Great way to TRACK and show GROWTH for progress monitoring with IEP GOALS, or really...any goals your students have! This is a spreadsheet set up for google sheets. All you need to do is enter the students information, their goal, and start tracking! Enter each time you test a student how they do, and a graph will be generated.
Subjects:
Grades:
Not Grade Specific
Types:
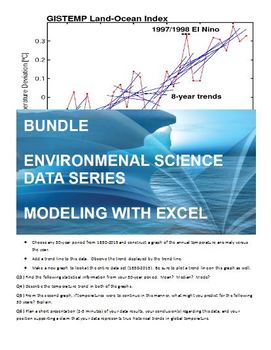
BUNDLE - Enviro Data Series - Using Microsoft Excel to Explore Climate Science
This bundle is a set of 3 Excel Spreadsheet Climate Investigations that can be used together or independently. Some basic knowledge of Microsoft Excel is helpful.
SAVE 50%!
This $6.00 bundle represents a discount of 50%, equaling a savings of $6.00 over the cost of purchasing all data series investigations individually.
Included in the Bundle:
Water Budget Modeling - COMING SOON!
Exploration of Temperature Anomalies
An Historical Record of CO2
Ice Sheet Modeling
You Might Also Like:
Environ
Subjects:
Grades:
10th - 12th
Types:
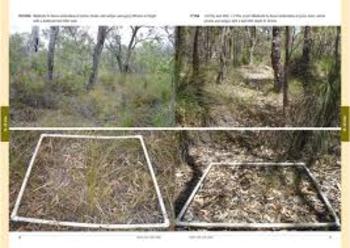
Ecology Lab: Micro-Plot sampling and graphing
Combined with field work (access to a forest is required), students collect data, and then return to class to use the data in two separate graphs. They create a paper-and-pencil graph, and they follow a set of detailed instructions to use their data in order to complete a graph using Microsoft Excel.
Subjects:
Grades:
4th - 6th
Types:
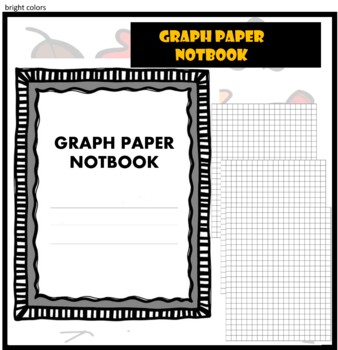
GRAPH PAPER NOTEBOOK
GRAPH PAPER NOTEBOOK 2022This paper book is a 102-page graph paper notebook consisting of pretty little square sheets in plain light blue, paper size 8.5 x 11 inches, 21.59 x 27.94 cm.★ ★This paperbook has several characteristics, including:· Plenty of space for writing or drawing· Font color is light blue· The size of the book is medium and suitable for different users and in different fields.· Pptx file containing lines and frame with transparent backgrounds that can be modified· JPG size 8.5
Subjects:
Grades:
7th - 12th, Higher Education, Adult Education, Staff
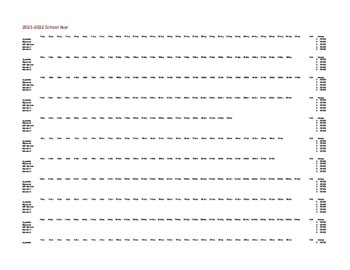
IEP Behavior Calculation
This template is a one stop shop. Insert your data and the rest is done for you. In this template you have the entire year month by month. Each month has 5 behaviors that you can calculate. Once you enter your numbers, the template will calculate the total and average, for each behavior, for that entire month. Once your month is filled out, you will go to the graph page where all your data will be graphed out for you.
Grades:
PreK - 12th, Higher Education, Adult Education
Types:
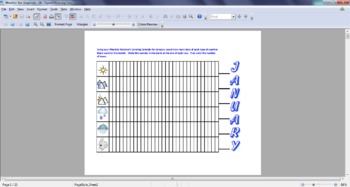
Weather Watcher's Monthly Bar Graph
After collecting data for the month on the Weather Watcher's Coloring Calendar, use this blank chart for analyzing the amount of each type of weather experienced in that month. This chart features colorful, easy to identify symbols for basic types of weather and clear instructions. All 12 months included in this package.
Subjects:
Grades:
K - 3rd
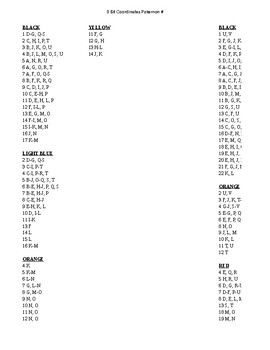
Pokemon coordinates
This excel workbook contains 6 coordinate pages for 6 different Pokemon characters, to be used with the 30x30 grid. Characters include Squirtle, Raichu, and Bulbasaur, to name a few.
Subjects:
Grades:
1st - 8th
Types:
Showing 1-14 of 14 results


