Creating Data Tables and Graphs in Google Sheets
Ian Meiser
1 Follower
Ian Meiser
1 Follower

Includes Google Apps™
The Teacher-Author indicated this resource includes assets from Google Workspace (e.g. docs, slides, etc.).
Description
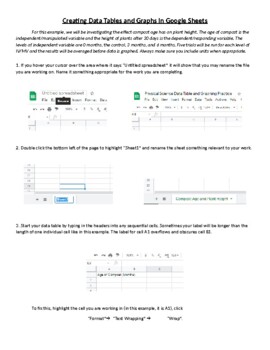
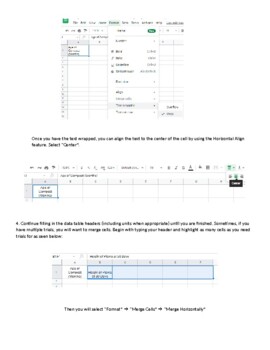
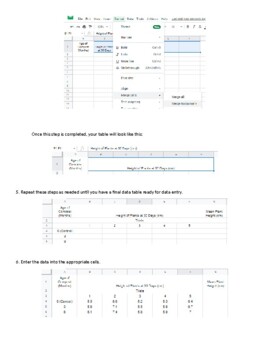
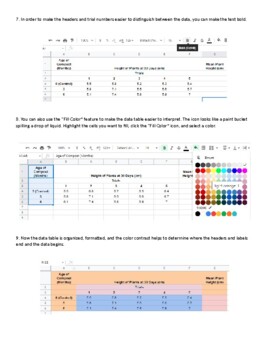
This is an activity that walks students through the process of organizing and entering data into a data table and then using that data to generate line, bar, and pie charts. Once the graphs are generated, the process of formatting and editing the different parts of each graph is explained.
Total Pages
14 pages
Answer Key
N/A
Teaching Duration
55 minutes
Report this resource to TPT
Reported resources will be reviewed by our team. Report this resource to let us know if this resource violates TPT’s content guidelines.


