262 results
Higher education statistics handouts
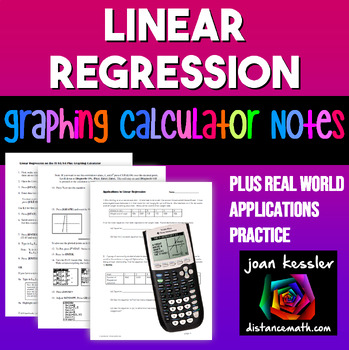
Linear Regression | TI-84 Graphing Calculator plus Applications
This clear, concise, step by step notes help your students use the TI 83 and TI 84 Graphing Calculator to enter data into lists, create a linear regression equation and to plot the equation along with the data simultaneously. Also included is a 3 page worksheet with five real world examples for students to practice. Solutions included. These can be used as Binder Notes or printed smaller for Interactive Notebooks._________________________________________________Related Products★ Quadratic Re
Subjects:
Grades:
9th - 11th, Higher Education
Types:
CCSS:
Also included in: Linear Functions and Systems Algebra 2 Unit 2 Activity Bundle
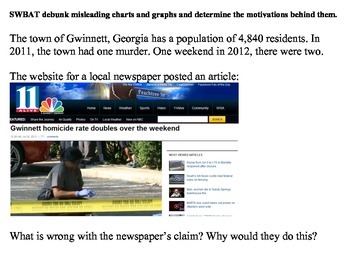
Misleading Charts and Graphs (Statistics)
Teaching students to deduce information provided in charts and graphs is an essential part of any math curriculum.
However, what do you do when the graph itself provides misleading or false information?
This lesson is a good way to get students to look critically at graphically displayed data and see through those who try to manipulate data for their own purposes.
Subjects:
Grades:
7th - 12th, Higher Education, Adult Education
Types:
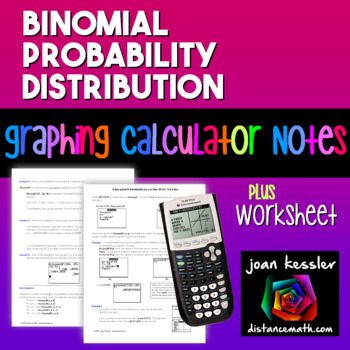
Statistics Binomial Probability Distribution TI-84 Reference Sheet and Practice
This Binomial Probability Distribution Reference Sheet and Practice for the TI-83 TI-84 Plus will help your students and give them the tools to work through problems in Statistics. These can be used as Binder Notes or printed smaller for Interactive Notebooks.IncludedEasy to follow handout helps you teach your students how to to find Binomial Probabilities on the TI-83 Plus and TI-84 Plus Graphing Calculators. The handout is a concise 2 page guide with examples. Great to add to your students
Subjects:
Grades:
10th - 12th, Higher Education
Types:
CCSS:

AP Psych / AP Psychology - Unit 1: Scientific Foundations - Activity Pack!
Includes the wildly popular ESCAPE ROOM Activity, as well as analyzes and practices nearly all standards regarding Unit 1: Scientific Foundations of Psychology, including 1.B, 1.C, 1.E, 1.F, 1.G, 1.H, 1.I, 1.J, 1.L, 1.M, 1.N, and 1.O!In class or as homework, students must assess, analyze, graph, calculate, and interpret data regarding psychological studies. All questions are original, and modeled after the College Board format and difficulty. After learning about the topics in class, these are
Subjects:
Grades:
8th - 12th, Higher Education, Adult Education, Staff
Types:
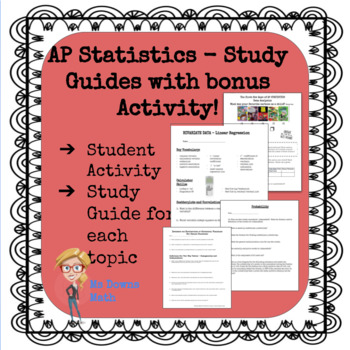
AP Statistics Study Guides - All Topics!
There is a pdf file study guide for each topic in the AP Statistics curriculum. Exploring Data, Normal Distributions, Linear Regressions, Experiments and Designing Studies, Probability, Random Variables, Sampling Distributions, Confidence Intervals, Hypothesis Tests, Comparing Populations, Chi Square Procedures, and Inference about Regression. I have students complete one for each unit. At the end of the year, they have a great study packet for the AP Exam! Student feedback has indicated that th
Subjects:
Grades:
9th - 12th, Higher Education, Adult Education
Types:
CCSS:
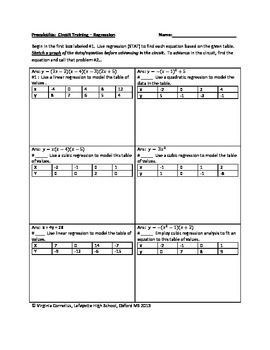
Circuit Training - Polynomial Regression (precalculus)
This 12-question circuit requires the use of technology. Students will perform regressions for linear, quadratic, cubic, and quartic tables of values. The technology will display the answers in expanded form, but most of the answers on the circuit are in factored form, so students need to start making connections with the zeros of functions in order to advance in the circuit.
The circuit contains all of the answers since that is the way students check their work and stay engaged with the pr
Subjects:
Grades:
11th - 12th, Higher Education
Types:
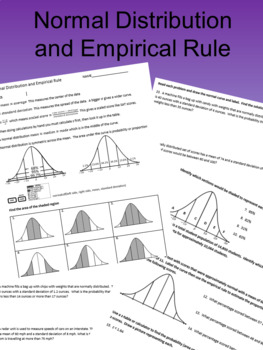
Normal Distribution and Empirical Rule Revised
This is a new and improved version of an older but popular product of mine Normal Distribution and Empirical Rule . It includes notes on the normal distribution with cleaner graphics and all new problems:It then includes 6 problems where they use the empirical rule to estimate the shaded region from a picture. Then 4 problems where they select the regions to give a desired area. A word problem where they label the curve and solve using normal distribution. The second side contains 4 problems wh
Subjects:
Grades:
9th - 12th, Higher Education, Adult Education
Types:
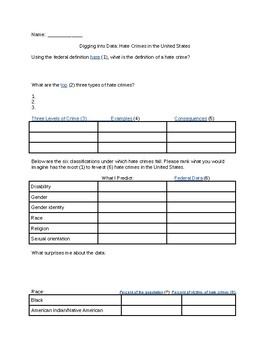
The 57 Bus- Looking at Hate Crime Data
A guided web search on hate crime data from the FBI, CDC, Pew Research Center, and U.S. Census Bureau. Uses reflection questions to make conclusions and predictions about the distribution of hate crimes. The kids are fascinated by the data!
Subjects:
Grades:
7th - 12th, Higher Education, Adult Education
Types:
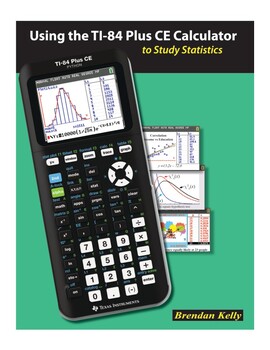
Using the TI-84 Plus CE Graphing Calculator to Study Statistics
Using the TI-84 Plus CE Calculator to Study StatisticsISBN 978-1-895997-59-0(102 pages; 8.5” x 11” trim size)The information age has made statistics one of the most important branches of mathematics. The ubiquity of real-world data enables us to explore statistical concepts using real data from interesting and current sources. As they work through the exercises in this book, students enter real data onto spreadsheets or into statistical plots on the TI-84 Plus CE Calculator while you guide their
Subjects:
Grades:
10th - 12th, Higher Education
Types:
CCSS:
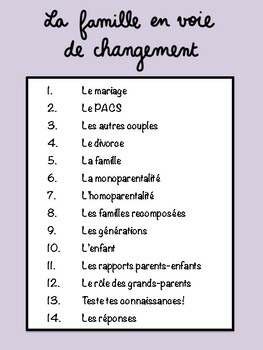
La famille- Infographie- Family Trends- AP French (intermediate to advanced)
In the resource file, you will find 12 infographic sheets on the topic of family trends for students of French (intermediate to advanced) + a test (and answers). All facts and statistics are linked to France. These can be used for flipped learning, revision material, independent study etc…The resource comes as a 15 pages booklet (including the content page) as well as 14 files for single pages, should you wish to send specific aspects to your students.Please note: The sheets are in .pdf format a
Subjects:
Grades:
9th - 12th, Higher Education, Adult Education
Types:

Misleading Statistics
Did you know that 90% of all serial killers are right-handed?
Well, of course... 90% of all people in general are right-handed.
This is a great activity that can be used as an introduction to any statistics class or unit. It makes students think about how people misinterpret statistics and how two people can look at the same data and draw different conclusions.
Subjects:
Grades:
7th - 12th, Higher Education, Adult Education
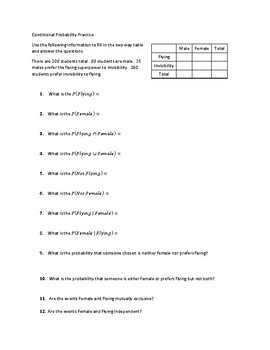
Conditional Probability Practice
This worksheet includes 18 problems with conditional probability, probability from a two way table, probability from a tree diagram, includes intersection, discusses mutually exclusive events and independent events.
Subjects:
Grades:
9th - 12th, Higher Education, Adult Education
Types:
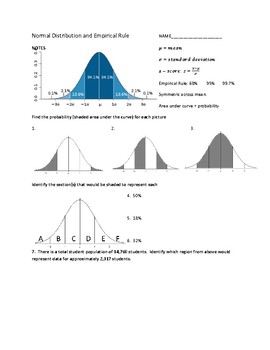
Normal Distribution and Empirical Rule
I've used this worksheet in going over normal distribution problems in my Algebra II class. It includes notes on the normal distribution, z-score, empirical rule, and basic properties of the normal distribution. It then includes 3 problems where they use the empirical rule to estimate the shaded region from a picture. Then 3 problems where they select the regions to give a desired area. A word problem using normal distribution. The second side contains 6 problems where they must calculate t
Subjects:
Grades:
9th - 12th, Higher Education
Types:
Expected Value: Probability Worksheet
This math worksheet asks students to calculate expected value and fair price given various scenarios including business ventures, games of chance, and investments. A brief description of these formulas is given and then students will calculate the expected value or fair price as indicated for each question given probability, data, or a chart.Two versions of this worksheet are included. One version use tables to help students identify and match possible outcomes to probability and net earnings/lo
Subjects:
Grades:
10th - 12th, Higher Education
Types:
Also included in: Intro to Probability Worksheet Bundle
College Statistics Mini-Posters/Study Guides
This is a resource I created back in 2011 to help me get through a college-level statistics course that someone in the universe thought would absolutely be necessary for someone that would only be teaching in an elementary school! I am both a visual and a tactile learner and back then, this was the only way that I could take and review notes that would stick in my brain. TBT my handwritten notes never made any sense to me when I had to do the homework later on in the day/week.I am pretty sure th
Subjects:
Grades:
9th - 12th, Higher Education
Types:
AND & OR Probabilities: Probability Worksheet
This math worksheet asks students to calculate empirical and theoretical compound probabilities with keywords "and" and "or".The answer key is attached.If you would like your students to have a better understanding of basic probability calculations first, please check out my Free - Empirical and Theoretical Probability Worksheet (practice problems) and/or my Empirical and Theoretical Probability Lab (hands-on group activity).This worksheet was designed for a college freshman course, Quantitative
Subjects:
Grades:
8th - 10th, Higher Education
CCSS:
Also included in: Intro to Probability Worksheet Bundle
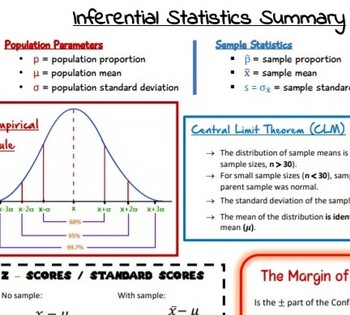
Inferential Statistics Summary
Included: complete PDFA summary of the notation and formulas for Higher Level Leaving Certificate Inferential Statistics:Empirical RuleCentral Limit TheoremZ / Standard ScoresMargin of ErrorConfidence IntervalHypothesis TestP Value
Subjects:
Grades:
11th - 12th, Higher Education
Types:
Graphic Organizers for Statistics - ALL THREE PARTS
This is a combined package of all three parts of my Graphic Organizers for Statistics. It includes all the organizers from
Part I: Descriptive Statistics,
Part II: Sampling & Probability, and
Part III: Inferential Statistics.
Please see the individual products for more info.
Subjects:
Grades:
11th - 12th, Higher Education, Adult Education
Types:
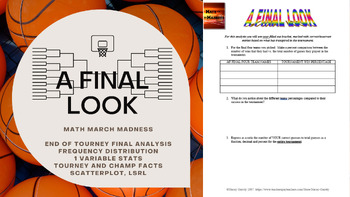
Math March Madness - A Final Look (Freq Distributions, Stats, Regression Lines)
Fill out a bracket, watch the tournament unfold and then mathematically analyze how you did! This activity is flexible enough to be used for a variety of levels. I have used all 6 pages for an AP Statistics class, and have used pages 1 through 5 for an Algebra or Algebra 2 class. You could even use it in lower levels as long as you are covering percents, and basic stats like mean, median, mode and graphing. The document is editable so you can adjust/delete to tailor to the level of statistic
Subjects:
Grades:
4th - 12th, Higher Education
Types:
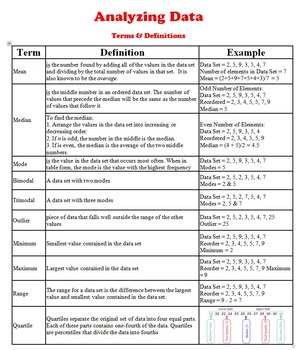
Data Analysis - Terms & Definitions (statistical measures definitions)
This Handout is part of : Maze - BUNDLE Statistical Measures (Mean, Median, Mode, & Range)
This handout is a quick reference sheet which includes the main definitions needed to introduce the data analysis terms in statistics. Terms such as: mean, median, mode, bimodal, outlier, minimum, range, quartile, box-and-whisker,.... etc. are some of the definitions shared on this handout.
Share it with your students, test them on it, and expect them to know it by heart. Those definitions are the
Subjects:
Grades:
6th - 12th, Higher Education, Adult Education
Types:
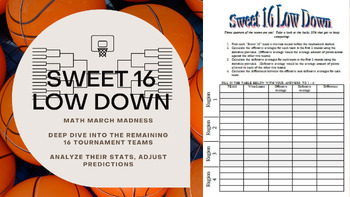
Math March Madness - Sweet 16 Low Down (Statistics Analysis of Final 16 Teams)
Join in the fun of the NCAA tournament at the Sweet 16 round! In this activity students analyze win percentages of the remaining 16 teams as well as research and compute their average offense and defense. This editable activity also asks students to analyze math presented in the real world by finding media and articles that use statistics to further their arguments.This can be used independently or check out these other items in my store for a comprehensive March Madness Project!Math March Mad
Subjects:
Grades:
4th - 12th, Higher Education
Types:
CCSS:
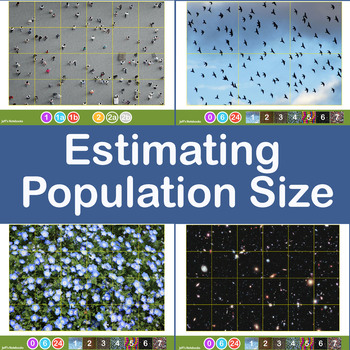
Estimating Crowd and Population Size using Jacob's Method
This investigation delves into estimating the size of a large population of objects by taking a sample and applying some basic mathematics. It encourages sharing of data, refining methods of collection of the data and discussion about the accuracy and limitations of the method used.Jacob's Method of counting large numbers of objects is simple. Draw a grid dividing the area covered into equal size squares. Estimate (by counting) the population of one grid then multiply this by the number of squar
Subjects:
Grades:
6th - 11th, Higher Education, Adult Education
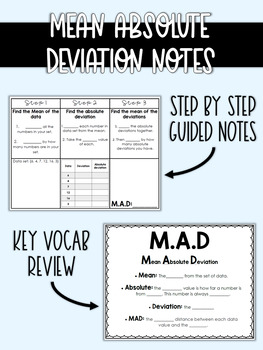
Mean Absolute Deviation Bundle
***NOW WITH DAILY TEACHER GUIDE FOR EASY IMPLEMENTATION***
This purchase also includes exclusive access to the highly rated MAD Anchor Chart!
This is the perfect unit bundle to teach Mean Absolute Deviation in a way that the students will understand and ENJOY! This unit proved very effective according to last year's STAAR scores. Included:
M.A.D. organizer to laminate or print!
3 Warm-ups
2 days of guided notes
1 individual activity
1 Cooperative Activity
1 Kahoot review
1 mini-assessment
ALL
Subjects:
Grades:
7th - 12th, Higher Education, Adult Education
Types:
Showing 1-24 of 262 results


