84 results
Higher education statistics centers
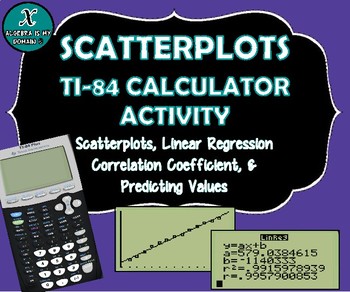
TI-84 CALCULATOR ACTIVITY - Data, Scatterplots, Regression & Line of Best Fit
This file includes four linear regression examples (all real-life data). The examples cover the following topics for the TI-84 graphing calculator:
* Creating a scatterplot
* Performing linear regression (finding the equation of the best-fit line)
* Interpreting the slope of the equation
* Calculating and interpreting the correlation coefficient
* Predicting values (using the linear regression equation)
The first example gives the step-by-step instructions to calculate all the necessary value
Subjects:
Grades:
7th - 12th, Higher Education
Types:
CCSS:
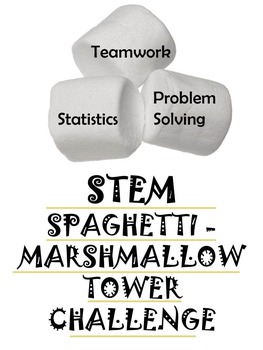
BACK TO SCHOOL STEM ACTIVITY: Spaghetti Marshmallow Challenge
Don't miss out on this wonderful opportunity for your students to work collaboratively, problem-solve, show creativity and use their math skills! This Spaghetti Marshmallow Challenge cost me less than $2.00 for all supplies but delivers such a big bang for the buck! Fun for students K-12 (they say that the kindergarteners actually build the highest!). Enjoy!
Subjects:
Grades:
PreK - 12th, Higher Education, Adult Education, Staff
Types:
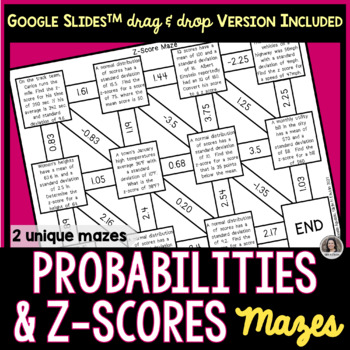
Z Scores and Probabilities of Normal Distributions Mazes Google Slides™ & Print
Make practicing math more fun with these 2 different mazes on finding z-scores and probabilities of normal distributions. For each self correcting maze activity, students will solve at least 9 problems. Types of Mazes*Finding Z-Score from a Word Problem Maze #1*Finding Probabilities or X-Values Given the Z-Score Maze #2Students may complete their work on the provided student response sheet that corresponds to the maze assigned. Note: Not all boxes are used. Included:TWO unique MazesA pdf with a
Subjects:
Grades:
6th - 12th, Higher Education
Types:

Observational Study vs. Survey vs. Experiment Sort
Students sort 15 scenarios into 3 categories: observational study, survey, and experiments. The then cut out scenario and glue it in the correct area. If you like this activity, please consider following my store and checking out other products. I would love to hear your feed-back in your review.
Subjects:
Grades:
11th - 12th, Higher Education
Types:
Also included in: GSE Algebra 2 Unit 7 Bundle
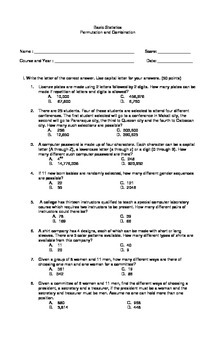
Probability and Statistics Multiple Choice on Permutation and Combination
Grab this Worksheet! a 25 multiple choice questions on probability's Permutation and Combination that will enhance and gain student's understanding on the topic!you can have this as a quiz or as a practice exercises in your class! a must have!!Viva Math!
Subjects:
Grades:
9th - 12th, Higher Education, Adult Education
Types:
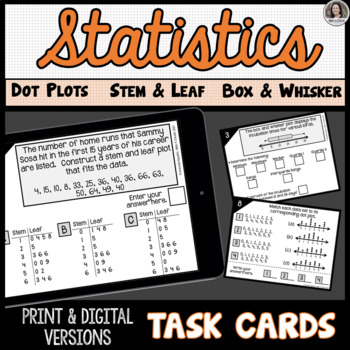
Statistics: Steam and Leaf Plots, Dot Plots, Box and Whisker Plots Task Cards
Students will practice constructing and interpreting stem and leaf plots, dot plots, and box and whisker plots by completing these 16 unique task cards. Students will demonstrate a deep understanding of the various plots by identifying key concepts: Mean, Median, Mode, Range, Interquartile Range, Minimum, Maximum, and/or Quartiles. This activity is an ideal assignment for students to complete at the conclusion of a Statistics unit for review and extra practice.Tasks Include:Construct a stem and
Subjects:
Grades:
6th - 12th, Higher Education
Types:
Data Analysis Statistics and Probability worksheets (63 Problems) (SAT Review)
Data analysis statistics and probability worksheets ,63 problemsSAT ReviewFraction and Data (29 Multiple choice questions)Statistic Problem (15 questions)Probability Word Problems This section contains 19 word problems about :Simple ProbabilityCounting PrincipleIndependent ProbabilityDependent ProbabilityMutually Exclusive EventsPermutationsCombinationsConditional Probability* AlSO AVAILABLE FOR YOU OR A COLLEAGUE! - CLICK ANY LINK YOU WANT:Number and Operations (SAT Review) Algebra & Functi
Subjects:
Grades:
7th - 12th, Higher Education, Adult Education, Staff
Types:
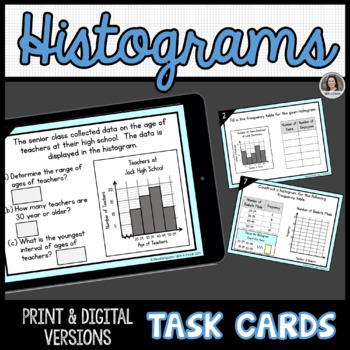
Histograms Task Cards, Print and Digital Google Slides™
Students will practice graphing, reading, and interpreting histograms by completing these 12 unique task cards. Tasks Include:Given a histogram or frequency table, interpret the informationCreate a frequency table for the given histogram.Construct a histogram for a given frequency table or set of data.Determine the class width for a given set of dataConstruct a frequency table for a given set of data.Included:A pdf with a link to make a copy of the Interactive Google Slides™ for your own Google
Subjects:
Grades:
6th - 12th, Higher Education
Types:
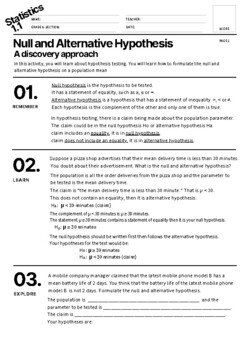
Statistics Null and Alternative Hypothesis Discovery approach
Having difficulty in teaching Null and Alternative Hypothesis?Does your student still confuse how to formulate the null and alternative hypothesis? Grab this Lecture- Activity -Quiz all in one all about how to formulate the null and alternative hypothesis.This includes, all the important points to remember. Easy to understand and student's learn it by discovering the meaning and concept by following this activity all through out.You don't need to teach long and keep on repeating for students who
Subjects:
Grades:
9th - 12th, Higher Education, Adult Education
Types:
Normal Distribution Joke Worksheets
Students solve the numbered problems. Each problem matches one of the lettered answers. They then fill in the corresponding letters in the table at the bottom of the page to answer the joke. The first worksheet is 7 problems using the z-score formula to find different values. The second worksheet 16 problems using normal calculations, including area to the left, area to the right, area between, and inverse calculations. The first version of the scarecrow worksheet has solutions from a calculator
Subjects:
Grades:
11th - 12th, Higher Education
Types:
Also included in: GSE Algebra 2 Unit 7 Bundle
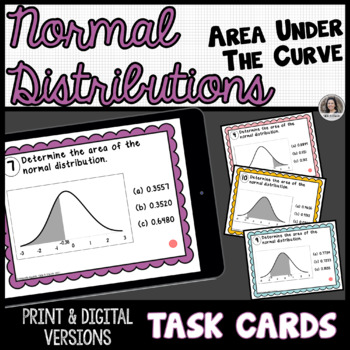
Normal Distributions Area of the Graph Print and Digital Slides Task Cards
Students will demonstrate their understanding and strengthen their math skills by completing these 12 unique task cards on finding probabilities of normal distributions given a graph. Students will practice finding the area to the left, to the right and between given z-scores under the normal curve. A recording worksheet is included for students to show work. Included:A pdf with a link to make a copy of the Interactive Google Slides™ for your own Google Drive™A printable version of the Task Card
Subjects:
Grades:
7th - 12th, Higher Education
Types:
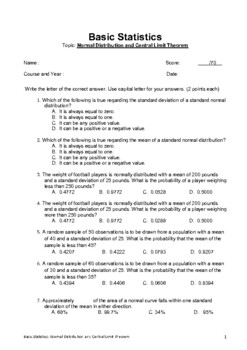
Statistics Multiple Choice Quiz: Normal Distribution and Central Limit Theorem
Basic StatisticsThis quiz covers:- Normal Distribution- Central Limit TheoremThis quiz contains 35 multiple choice questionsThe 35 multiple choice questions covers about terms, definition and calculations about Normal distribution and Central Limit Theorem.The questions in terms and definition in this multiple choice are simple this will test the understanding of students if they understand the concept of Normal Distribution and Central Limit Theorem.I have provided an answer key in this multipl
Subjects:
Grades:
8th - 12th, Higher Education, Adult Education
Types:
Permutations and Factorial Notation Worksheet (17 Questions)
Permutations and Factorial Notation Worksheet17 Questions with the solutions1 page for the questions1 page for the answers* AlSO AVAILABLE FOR YOU OR A COLLEAGUE! - CLICK ANY LINK YOU WANT:Probability & OddsMean, median, mode, range, line plot, and Box and whisker WorksheetStatistical Math (GED REVIEW)The Binomial Theorem Worksheet (10Q)Theoretical Probability WorksheetProbability Word Problems (Worksheet) You may also be interested in my other top-selling products: EQUIVALENT FRACTIONS (33
Subjects:
Grades:
9th - 12th, Higher Education, Adult Education, Staff
Types:
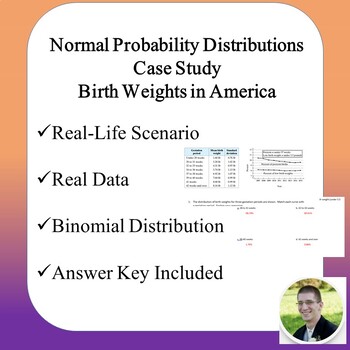
Normal Probability Distribution Case Study (Unit 5)
Normal Probability Distributions: Birth Weights in America Case Study (Unit 5) Do you have students in class who are always asking “When will we ever use this?” If so, this Case Study is for you! Each Case Study features actual data from a real-world context and questions that illustrates the important concepts of the chapter. It is also a good way to highlight jobs in the work force that use statistics on a daily basis! In this particular Case Study we look in at data from The National Center f
Subjects:
Grades:
9th - 12th, Higher Education
Types:
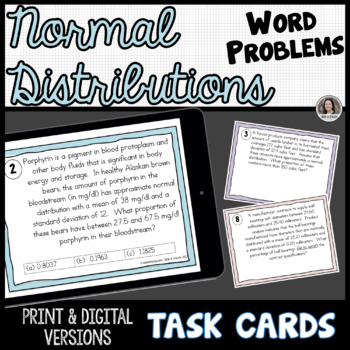
Normal Distributions Word Problems Print and Digital Google™ Slides Task Cards
Students will demonstrate their understanding and strengthen their math skills by completing these 12 unique task cards on normal distributions word problems. Students will practice finding the percent or proportions to the left, to the right and between given values. A recording worksheet is included for students to show work. Included:A pdf with a link to make a copy of the Interactive Google Slides™ for your own Google Drive™A printable version of the Task CardsA recording worksheet for stude
Subjects:
Grades:
7th - 12th, Higher Education
Types:
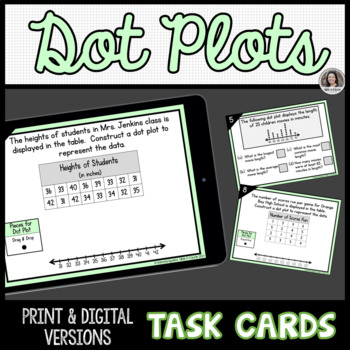
Dot Plots Task Cards, Print and Digital Google Slides™
Students will practice graphing, reading, and interpreting dot plots by completing these 12 unique task cards. Tasks Include:Create a dot plot given a set of dataDetermine mean, median, mode, range, 1st quartile, and 3rd quartile of a dot plotDescribe the shape of distribution of a dot plotIncluded:A pdf with a link to make a copy of the Interactive Google Slides™ for your own Google Drive™A printable version of the Task CardsA recording worksheet for students to show work.Answer keyDigital Vers
Subjects:
Grades:
6th - 12th, Higher Education
Types:
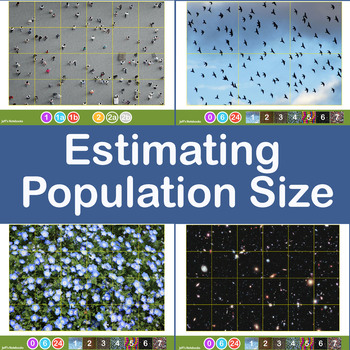
Estimating Crowd and Population Size using Jacob's Method
This investigation delves into estimating the size of a large population of objects by taking a sample and applying some basic mathematics. It encourages sharing of data, refining methods of collection of the data and discussion about the accuracy and limitations of the method used.Jacob's Method of counting large numbers of objects is simple. Draw a grid dividing the area covered into equal size squares. Estimate (by counting) the population of one grid then multiply this by the number of squar
Subjects:
Grades:
6th - 11th, Higher Education, Adult Education
Centimeter & 1 Inch Grid Papers (Full Sheets Each)
A full sheet of Centimeter Grid Paper and a full sheet of 1 inch Grid Paper all contained in one easy to transport/store .pdf. You can use these sheets with making charts, plotting points, etc... Enjoy and thank you for your support.
Subjects:
Grades:
PreK - 12th, Higher Education, Adult Education, Staff
Types:
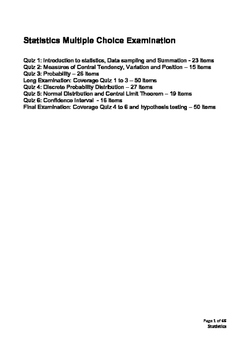
Statistics Multiple Choice Exams complete Quiz 1 to 6 plus final exams
This is a collection of 6 statistics exams plus two long exams which can be used as final examination.I believe this exam would help your math class especially the low achievers. It is designed as clearly as possible and easy for students to understand and give them a meaningful understanding toward statistics as a subject.The exams are in multiple choice exam type except for two which i have added a matching type after the multiple choice part.Below is the summarize of the topics which are incl
Subjects:
Grades:
7th - 12th, Higher Education, Adult Education
Types:
Statistics Quantitative Data Boxplots- 5 Number Summary Data CP, AP Stats
If you are looking for an activity sheet that will engage students as they aim to practice and apply taught concept this box plot activity is the one. It is excellent if you want to check students understanding while having fun. This activity helps students to describe the shape of quantitative distribution, identify centers and spreads by analyzing quartiles (measure of center and variability) . Use the SOCS method to describe the shape, center, spread and outlier as well as other unusual feat
Subjects:
Grades:
7th - 12th, Higher Education, Adult Education
Types:
CCSS:

Confidence Intervals Case Study (Unit 6)
Confidence Intervals: Marathon Training Case Study (Unit 6) Do you have students in class who are always asking “When will we ever use this?” If so, this Case Study is for you! Each Case Study features actual data from a real-world context and questions that illustrates the important concepts of the chapter. It is also a good way to highlight jobs in the work force that use statistics on a daily basis! In this particular Case Study we look in at data from the 60 marathon runners in training. The
Subjects:
Grades:
9th - 12th, Higher Education
Types:
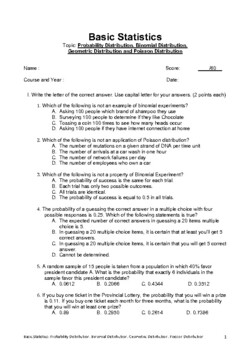
Statistics Multiple Choice Quiz: Binomial, Geometric & Poisson Distribution
Basic StatisticsThis quiz covers:- Probability Distribution- Binomial Distribution- Geometric Distribution- Poisson DistributionThis quiz has multiple choice on test 1 (19 questions) and a matching type on test 2 (11 question)The 19 multiple choice questions covers about terms, definition and computation about probability distribution, binomial distribution, geometric distribution and poisson distribution while the 11 matching type question is matching the type of distribution as Binomial, Geome
Subjects:
Grades:
8th - 12th, Higher Education, Adult Education
Types:
AP Statistics Formula Posters
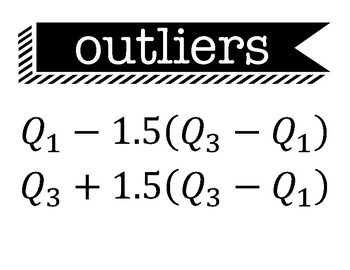
These pages contain a great way to display the formulas students are required to know for the AP Statistics exam. These can be printed on 8.5"x11' paper and displayed in your classroom! This product contains 14 pages with the following formulas and definitions:OutliersResiduals, Standard score,Combining mean and variance,Converting mean and variance, Geometric Probability and mean,exponential and power model, definitions for confidence level, p value, and r squared
Subjects:
Grades:
9th - 12th, Higher Education, Adult Education
Math Lab on ratios, fractions, percentages, and decimals with playing cards
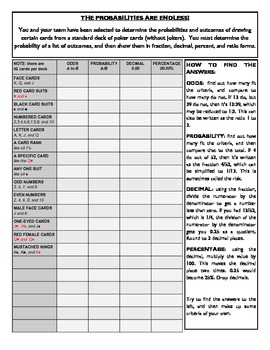
This lesson showcases how ratios, fractions, decimals, probabilities, and percentages are all similar ways of looking at the same thing. By using a deck of playing cards, a team can search for the chances of pulling out a face card, a numbered card, a red face card, an odd numbered card, and many more... there is also room for a few of your own combinations.
There is a brief explanation on how to find each of the different statistics in the margin, and you can check the answers on the second p
Subjects:
Grades:
4th - 12th, Higher Education, Adult Education
Types:
Showing 1-24 of 84 results


