44 results
Higher education statistics research
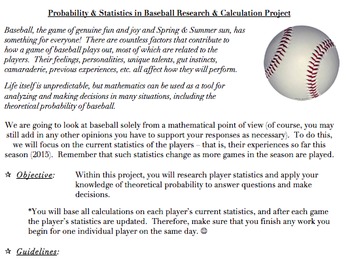
Probability & Statistics in Baseball Project (Common Core Aligned, AND FUN!)
The problems and activities within this document are designed to assist students in achieving the following standards: 6.SP.B.5, 7.SP.C, HSS.CP.A.2, HSS.CP.A.3, HSS.CP.B.7, HSS.CP.B.9, as well as the standards for mathematics practice and the literacy standards. They are also designed to help the teacher assess the students’ abilities when it comes to working with the ideas within the standards.This document contains the following:A project designed to allow students to investigate theoretical
Subjects:
Grades:
5th - 12th, Higher Education, Adult Education, Staff
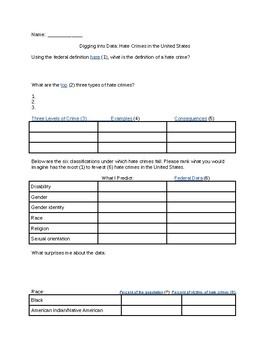
The 57 Bus- Looking at Hate Crime Data
A guided web search on hate crime data from the FBI, CDC, Pew Research Center, and U.S. Census Bureau. Uses reflection questions to make conclusions and predictions about the distribution of hate crimes. The kids are fascinated by the data!
Subjects:
Grades:
7th - 12th, Higher Education, Adult Education
Types:
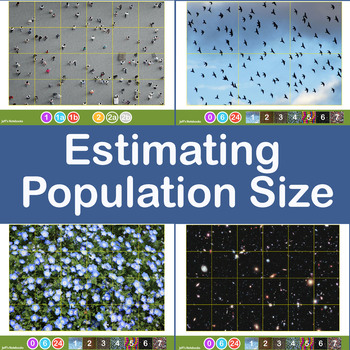
Estimating Crowd and Population Size using Jacob's Method
This investigation delves into estimating the size of a large population of objects by taking a sample and applying some basic mathematics. It encourages sharing of data, refining methods of collection of the data and discussion about the accuracy and limitations of the method used.Jacob's Method of counting large numbers of objects is simple. Draw a grid dividing the area covered into equal size squares. Estimate (by counting) the population of one grid then multiply this by the number of squar
Subjects:
Grades:
6th - 11th, Higher Education, Adult Education
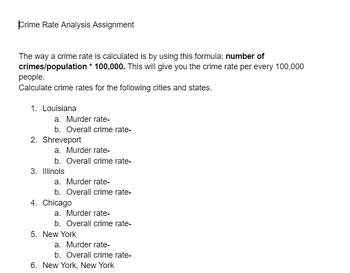
Crime Rate Analysis Assignment
A web based assignment to allow students to calculate the crime rates of various U.S. cities.
Grades:
5th - 12th, Higher Education, Adult Education
Types:

Creating Surveys and Analyzing Data, In-Class Activity
This activity walks students through the process of creating a survey, collecting results, and analyzing data. It is an assignment that can be done independently by students in class. Students that have any difficulty should be able to easily get assistance from fellow students. Rather than simply learning the terminology that comes with surveys and collecting research data, the student will use critical thinking to create and analyze their own surveys.
Subjects:
Grades:
10th - 12th, Higher Education
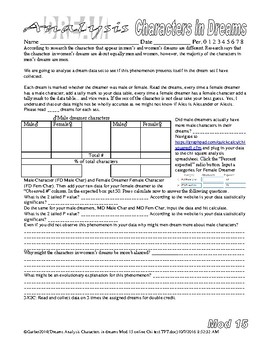
Psychology Dream Analysis Characters and Emotions in Dreams Freud
In these two labs the students analyze a dream set for characters, emotions and animals in dreams respectively. Research says that the characters in women’s dreams are about 50/50, men and women, but in men’s dreams there are more male characters than female characters. One of the labs focuses on this phenomenon. We endeavor to see if this is true in our dream set. The second lab focuses on whether whether or not men or women have more negative or positive dreams. 11/8/22 Animals in dreams is no
Subjects:
Grades:
10th - 12th, Higher Education
Types:
e-Learning AnEconomist Online Course Coupen
Please email this Coupen: TEACHPAYCOUP when you register for the courses in Econometrics, Stata, Matlab, SPSS, Eviews and R. You get 100GBP off the portal fee. Register on http://elearning.aneconomist.com and email on moodle@aneconomist.com ask for discounted invoice for your course. All courses are offered Online, Live and Personalized. Each lecture is recorded and recordings DVD will be provided after the course is completed.
Grades:
11th - 12th, Higher Education, Adult Education, Staff
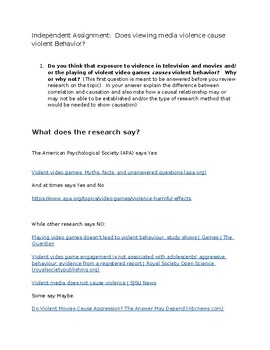
Does viewing media violence cause violent behavior? What does the research say?
This product asks students to weigh in on the possible causal connection between exposure to violent media and violent behavior. Students are asked to state their thoughts both prior to and after reviewing the existing literature on the topic. Research articles present arguments both affirming and denying the causal connection. Multiple meta-analysis article links are also provided. Students are asked to note if their stance on the issue changed after viewing the research and to explain why
Subjects:
Grades:
9th - 12th, Higher Education, Adult Education
Types:
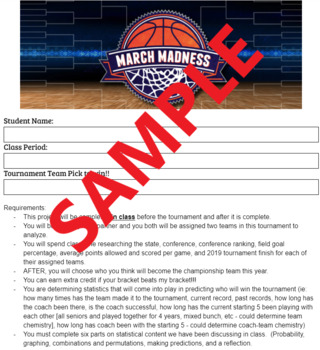
March Madness Statistics Project
High School and Middle School Statistics Class Project. March Madness is played by an estimated 25 to 30 million people each year and in this project our students will be part of the action! Don't worry, if you don't know one thing about basketball you will do fine with this project! Each student will become an researcher and pick two teams to win the tournament! Requirements:This project will be completed in class before the tournament and after it is complete.You will be able to pick a partne
Subjects:
Grades:
9th - 12th, Higher Education
Types:
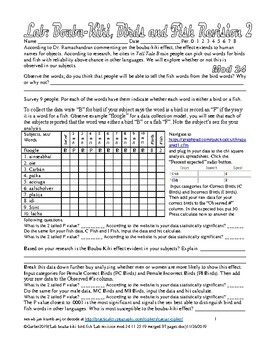
Psychology Lab Bouba Kiki Bird Fish lab Cognition Language
According to Dr. Ramachandran, commenting on synesthesia and the bouba-kiki effect, the effect extends to human names for objects. According to research he cites in Tell Tale Brain, people can pick out words for birds and fish with reliability above chance in other languages. We will explore whether or not this is observed in our population.Survey 24 non-psych friends. For each of the words have them indicate whether each word is either a bird or a fish.This is cool because my students almost al
Subjects:
Grades:
9th - 12th, Higher Education, Adult Education
Types:

Analyzing and Interpreting Quantitative Data Assessment
This product contains a set of 26 multiple-choice questions focused on quantitative data analysis. It is designed for educators, researchers, and students who want to test their knowledge or prepare for exams in this field.Each question is structured to test the reader's understanding of a specific aspect of quantitative data analysis. The questions cover a range of topics, including statistical software selection, data cleaning, missing data, hypothesis testing, and effect size.The questions ar
Subjects:
Grades:
11th - 12th, Higher Education, Adult Education
Types:
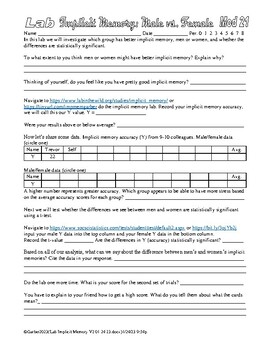
Psychology Lab Implicit Memory Test Cognition Statistics AP Psychology
I did a complete revision of this lab, the old website died. It is now a hard copy. In this lab the students navigate to https://www.labinthewild.org/studies/implicit_memory/ and do the implicit memory activity. They then collaborate to share data and perform a t-test to find out if the difference between male and female scores is statistically significant. You have managed to find the source of the best Psychology and AP Psychology labs on TPT, go check out my store for other awesome resources
Subjects:
Grades:
9th - 12th, Higher Education
Types:
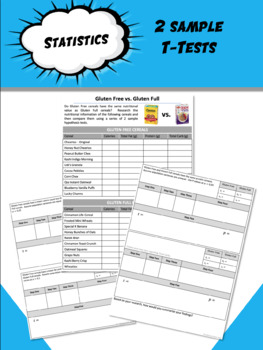
Gluten Free v Gluten Full--2 Sample T Tests
This is math in the REAL WORLD! Part one: Collect DataThe quality and integrity of statistics rests upon the accuracy of your dataPart two: Analyze DataStudents compare Calories, Protein Content, and Fat using 2-sample t-tests. Part Three: Create Your OwnIt's important for students to create and analyze their own research questions, so this give them a chance to come up with a question regarding the Carb content of cereals. *Model answer key is included, but data can vary!
Subjects:
Grades:
10th - 12th, Higher Education, Adult Education
Types:
TEST: Quantitative Data Collection - Sampling, Instruments, and Analysis
This test is designed to evaluate your understanding of key concepts related to quantitative data collection. It consists of 17 multiple-choice questions that cover a range of topics, including sampling procedures, instrument selection, and data analysis.The test begins by assessing your knowledge of unit of analysis, permissions required before beginning a study, and different types of populations and sampling procedures. It then moves on to explore the best sampling procedures to use in differ
Subjects:
Grades:
11th - 12th, Higher Education
Types:
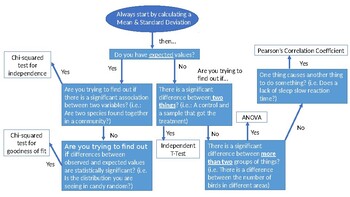
IB Biology: Internal Assessment Statistical Analysis Decision Tree
This product is a PowerPoint slide that can be modified to meet your needs and saved as a PDF to digitally provide to students. I had noticed that my students struggled with determining which statistical analysis was most appropriate for their Internal Assessment, so I created a decision tree for them. By being able to answer the questions on the decision tree, they will be able to appropriately analyze their data and reach their conclusion.
Subjects:
Grades:
11th - 12th, Higher Education, Adult Education
A Statistics Glossary with Symbols and Formulas
This is a very comprehensive statistics glossary from A to Z with a number of statistical symbols and formulas. It can be used as a resource book for any form of statistics in high school, undergraduate or graduate levels.
Subjects:
Grades:
9th - 12th, Higher Education, Adult Education, Staff

Statistics 1st Quarter Research Project
In this document, you'll find detailed instructions and grading rubrics for a data collection, organization, and presentation report based project. This is a google doc that will be added to your google drive when you purchase and will be fully editable to customize to your classroom needs. Students will: 1. learn to write an abstract, 2. describe the nature of their data, 3. choose, implement, and describe a sampling method, 4. discuss possible errors, 5. calculate mean, median, mode, midrange,
Subjects:
Grades:
11th - 12th, Higher Education
Types:
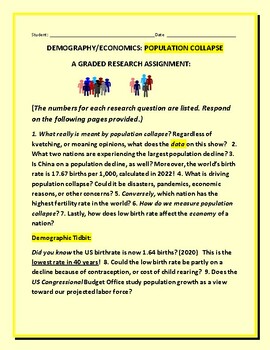
POPULATION COLLAPSE
This research assignment opens the eyes of students as to where we stand insofar as population collapse is concerned. Are we really aware of the consequences that are economic as well? This is a graded assignment. This assignment grade crosses over into demography (social studies), and economics. Thanks for visiting and supporting our humble shop. Excelsior! Statistics give birth to planning and development!
Subjects:
Grades:
9th - 12th, Higher Education, Adult Education, Staff
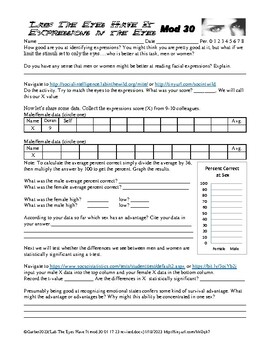
Psychology Lab Micro Expressions Emotions Ekman
In this lab the students navigate to a website participate in a micro expressions activity and analyze the results to determine if men or women are better at spotting micro expressions.They also explore the relationship between two types of expressions tests.The website is loosely based on the work of Dr. Ekman, the premier facial expression researcher.The test comes from a commercial website where the company is trying to sell it's program for identifying micro expressions.Try the website befor
Subjects:
Grades:
9th - 12th, Higher Education
Types:

Statistics Probability Report Project
In this document, you'll find detailed instructions and grading rubrics for a probability based project which includes the design and creation of a unique game, the testing of that game, and the calculation of various probabilities resulting from the game. This is a google doc that will be added to your google drive when you purchase and will be fully editable to customize to your classroom needs. Students will: 1. learn to write an abstract, 2. create and write instructions for a unique game, 3
Subjects:
Grades:
11th - 12th, Higher Education
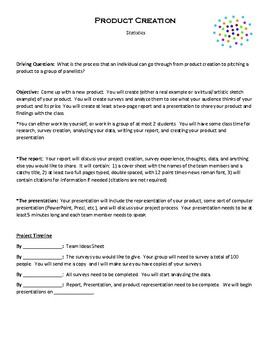
Statistics Product Creation
This is a great project to give Statistics students a chance for real world application and practice. The students will work individually or in small groups to create a product, write surveys for the product, hand out surveys, analyze surveys, create a presentation to share product and statistics, and write a report. I usually give this project a few weeks into the semester, give students some "in class" time to work on it every other week or on extra time, and then have a due date near the end
Subjects:
Grades:
11th - 12th, Higher Education
Types:
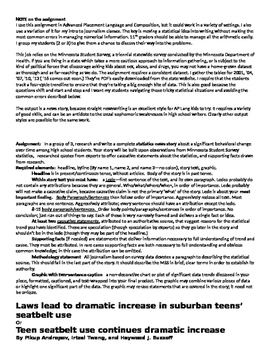
Statistics newswriting group project
A multiday project for advanced writers. Students use high-school health survey data (the Minnesota Student Survey or similar) to identify a trend over time in student behavior, then write about it in news style. Packet includes assignment parameters, explanations and demonstrations of the principles of newswriting, examples of newswriting with a statistical finding, step-by-step instructions for finding and documenting a trend, a glossary of relevant statistics terms, an explanation of various
Subjects:
Grades:
10th - 12th, Higher Education
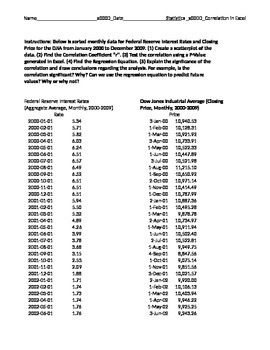
Correlation and Regression Activity - Interest Rates and the Dow
This is an activity in Microsoft Excel that analyzes interest rates set by the Federal Reserve and price of the Dow Jones Industrial Average from 2000 to 2009. This activity is intended for high school and college level statistics classes (also applies to economics classes). Students will use REAL DATA (included) to (1) create a scatter plot, (2) find the correlation coefficient using data analysis toolpak (or StatsPlusLE for Mac), (3) Test the significance of the correlation using P-values, (4)
Subjects:
Grades:
9th - 12th, Higher Education
Types:
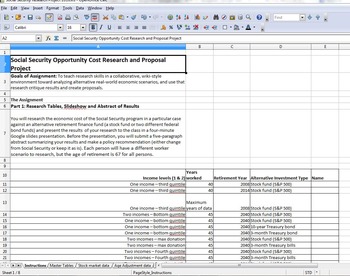
Social Security/Private Fund Benefit Comparison Project
This project for an Economics, Accounting or Statistics class utilizes public information on the Internet (including the Social Security Administration website) to compare Social Security benefits with a comparably-funded private retirement account.
All of the instructions and tables are provided in the attached Excel-format spreadsheet, other than data that needs to be culled directly from the Social Security Administration website (and instructions on how to pull that data is provided).
Th
Grades:
11th - 12th, Higher Education
Types:
Showing 1-24 of 44 results


