860 results
12th grade statistics handouts
AP Statistics Doodle Review Bundle
This Doodle Review Bundle would be great to review for the AP Exam before diving into practice problems. Have students fill in main ideas to help them remember what was taught earlier in the school year! An answer key is included. These Doodle Reviews are based on the chapters of TPS5e and are not aligned to the College Board CED. This Bundle includes the following Doodle Reviews:1 - One Variable Data2 - Density Curves3 - Two Variable Data4 - Designing Studies5 - Probability6 - Random Variables7
Subjects:
Grades:
11th - 12th
Types:
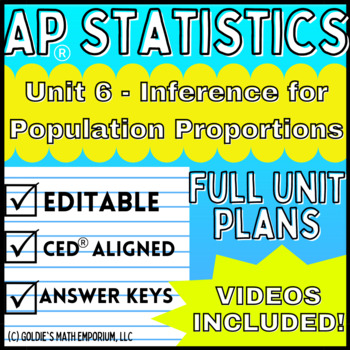
Goldie’s AP® Statistics UNIT 6 PLANS – Inference for Proportions
AP® Statistics Unit 6 – Inference for Categorical Data: ProportionsUnit BundleThis unit contains everything you need to teach "Inference for Categorical Data: Proportions" in AP® Statistics or regular-level Statistics. Students will go through how to justify conditions, calculate, interpret, and justify a claim about a confidence interval for a population proportion; identify the relationships between sample size, the width of a confidence interval, confidence level, and margin of error for a po
Subjects:
Grades:
10th - 12th
Types:
CCSS:
Also included in: Goldie's FULL CURRICULUM for AP® Statistics
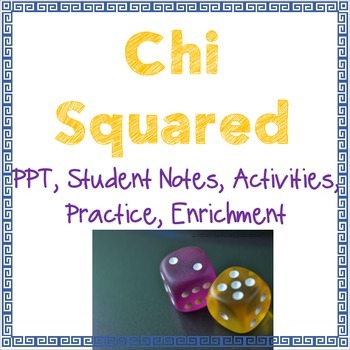
Chi Squared
Chi SquaredTeaching Chi Squared to a Stats class or AP Bio and not sure where to start?! Well, you found it. I created this product for my husband, who teaching AP Biology. This pack includes a PPT introduction, complete with student fill-in-the-blank notes, that walk students through the steps of Chi Squared and gives them a general overview of how and why we use this test. Degrees of Freedom are explained, as well as p-value. Notes provide an additional practice problem to do as a class. This
Subjects:
Grades:
9th - 12th
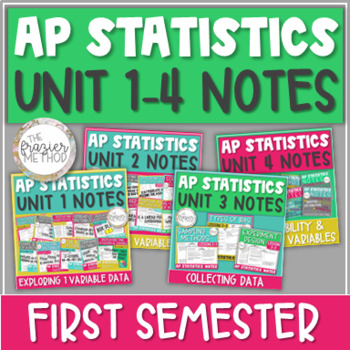
AP Statistics Notes Unit 1-4 Graphs, Linear Regression, Experiments, Probability
64 PAGES of AP® Statistics Notes! UNITS 1, 2, 3, & 4 - the entire FIRST SEMESTER of AP® Stats! Unit 1 includes histogram, box plot, median, mean, standard deviation, interquartile range, Normal Distribution, z-score... Unit 2 covers two way table, scatterplot, linear model, residual plot, correlation coefficient, linear regression computer output... Unit 3 has sampling methods, bias, experiment design... Unit 4 covers basic probability rules, compound probability of multiple events, conditio
Subjects:
Grades:
10th - 12th

Moneyball Movie Guide & ANSWERS | Moneyball Worksheet | Questions (2011)
Moneyball movie questions (released 2011) help keep students engaged throughout the film by providing 26 questions for them to answer to keep them on track. Moneyball worksheet comes with a key that has suggested answers provided at the end.Moneyball Movie Guide follows Billy Beane, general manager of the Oakland A's as he an epiphany about baseball's conventional wisdom is all wrong. Faced with a tight budget, Beane must reinvent his team by outsmarting the richer ball clubs. Joining forces wi
Subjects:
Grades:
5th - 12th
Types:
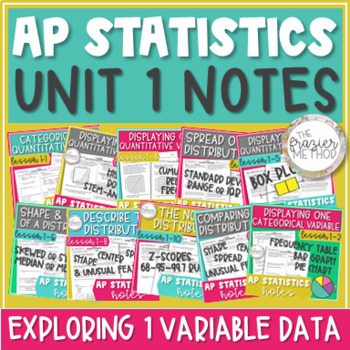
AP Statistics Notes Unit 1 Histogram, Box Plot, Skew, Mean, Normal Distribution
Use these AP® Statistics notes to teach UNIT 1 – EXPLORING ONE-VARIABLE DATA. Histograms, box plots, dot plots, stem-and-leaf plots, bar graphs, outliers, 5-number summary, z-scores, Normal Distribution / Normal Model, and describing a distribution's shape, center, & spread! Skewed or symmetric, median or mean, standard deviation or interquartile range... You can also use these notes for AP® Stats exam review! Aligns with the updated 2019-2020 objectives and standards of Unit 1: Exploring On
Subjects:
Grades:
10th - 12th
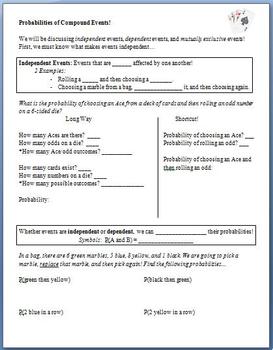
Probability of Compound Events (Guided Notes)
This lesson is meant to be used as guided notes for a whole class.
Students begin by learning what makes 2 events independent. After slowly working through a problem about rolling a die and choosing a card, they discover that they can multiply probabilities when working with these compound events. They then attempt problems involving picking marbles from a bag. Next, they learn about dependent events, and finally, mutually exclusive events.
The last 2 pages are a copy of the key.
Subjects:
Grades:
6th - 12th
Types:
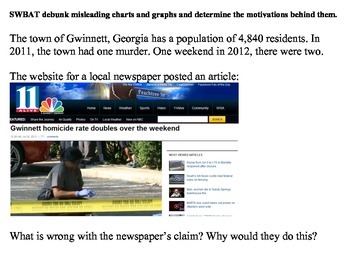
Misleading Charts and Graphs (Statistics)
Teaching students to deduce information provided in charts and graphs is an essential part of any math curriculum.
However, what do you do when the graph itself provides misleading or false information?
This lesson is a good way to get students to look critically at graphically displayed data and see through those who try to manipulate data for their own purposes.
Subjects:
Grades:
7th - 12th, Higher Education, Adult Education
Types:
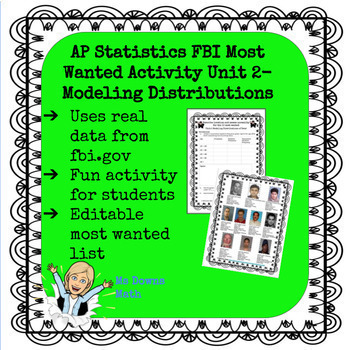
FBI Most Wanted AP Statistics, Modeling Data, Z scores and Normal Distributions
I created a series of activities for several units in the AP Statistics curriculum. The students love using data from fbi.gov to review concepts. This activity involves analyzing data related to the top 10 most wanted fugitives. I created this activity in May of 2020 and used the top 10 at that time. In the folder, you will find an editable slide of the top 10 if you want to change it.The answer key for the unit is based on the original top 10 that I used. Teachers have the option of having stud
Subjects:
Grades:
9th - 12th
Types:
CCSS:
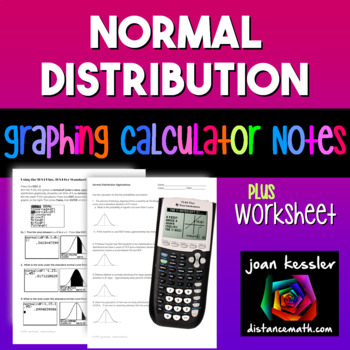
Normal Distribution | TI-84 Calculator Reference Sheet and Practice
With this Normal Distribution concise, step by step handout, your students will learn how to use the TI 83 and TI 84 Graphing Calculators to find probabilities for the Standard Normal Distribution and also find probabilities for Applications to the Standard Normal Distribution. They will also learn how to use the shade feature to construct a graph and have the calculator shade in the appropriate region.These can be used as Binder Notes or printed smaller for Interactive Notebooks.Note: This han
Subjects:
Grades:
9th - 12th
Types:
CCSS:
Standard Deviation Activity
This activity is scaffolded at each step so they can find the standard deviation of a data set independently. The fun part is that they collect their data by recording scores of an "Are You Smarter Than A 5th Grader?" quiz! Due to the scaffolded nature of this activity, it would be perfect for distance learning with some modifications. For example, they could collect data points by quizzing parents/family members. Or you can provide data points for them. Here's how I did it:1. As a warm-up, I ga
Subjects:
Grades:
8th - 12th

Hypothesis Test for a Population Mean - Analogy to a Criminal Trial
This is a student workbook that can supplement lessons on hypothesis testing for a population mean. The preview gives an example of pages from the workbook.I teach the stages of hypothesis testing using analogies to a criminal trial. My students like this comparison; they are more engaged and it helps them to see the relevance of the different stages. Once students are confident with the terminology, we create our own courtroom in the classroom and role-play the stages of hypothesis testing with
Subjects:
Grades:
9th - 12th
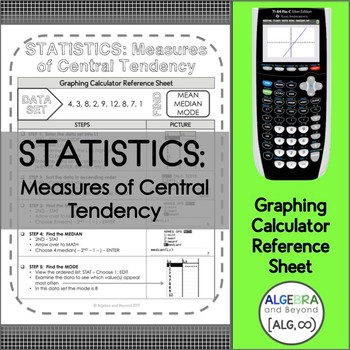
Statistics | Measures of Central Tendency | TI-84 Calculator Reference Sheet
This graphing calculator reference sheet on measures of central tendency guides students step-by-step on how to create a list and find the mean, median and mode.Teaching graphing calculator skills help students with: • Speed• Making connections• Checking for accuracy• Leaping hurdles*Reference sheet can be used with a TI-83 or TI-84 graphing calculator. Please look at the preview to find out more information about this resource.Check out more graphing calculator sheets here or get all of them...
Subjects:
Grades:
10th - 12th
Types:
CCSS:
Finding Mean, Median, Mode, and Range
Simple worksheets (5 problems each) to introduce and practice finding the mean, median, mode, and range of a data set. Have students complete with or without calculator, depending on their instructional level. Product includes:-Reference posters for mean, median, mode, and range. Each poster includes the measures' definitions and directions for how to find them with an example.-5 worksheets about finding the mean.-5 worksheets about finding the median.-5 worksheets about finding the mode.-5 work
Subjects:
Grades:
1st - 12th
Types:
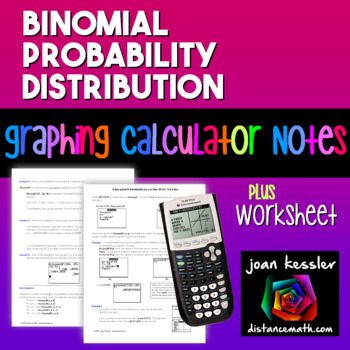
Statistics Binomial Probability Distribution TI-84 Reference Sheet and Practice
This Binomial Probability Distribution Reference Sheet and Practice for the TI-83 TI-84 Plus will help your students and give them the tools to work through problems in Statistics. These can be used as Binder Notes or printed smaller for Interactive Notebooks.IncludedEasy to follow handout helps you teach your students how to to find Binomial Probabilities on the TI-83 Plus and TI-84 Plus Graphing Calculators. The handout is a concise 2 page guide with examples. Great to add to your students
Subjects:
Grades:
10th - 12th, Higher Education
Types:
CCSS:
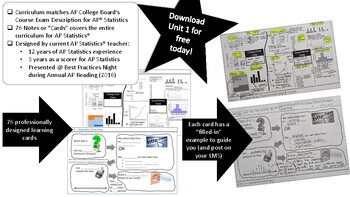
AP Statistics Learning Cards - Full Curriculum - Units 1 thru 12
AP Statistics' Learning Cards are professionally designed fill-in-the-blank cards that match the AP Statistics Course Description76 Learning cards in allWord documents provide 3 different formats to present to studentsPowerPoint presentation fileAll documents are editable
Subjects:
Grades:
9th - 12th

AP Psych / AP Psychology - Unit 1: Scientific Foundations - Activity Pack!
Includes the wildly popular ESCAPE ROOM Activity, as well as analyzes and practices nearly all standards regarding Unit 1: Scientific Foundations of Psychology, including 1.B, 1.C, 1.E, 1.F, 1.G, 1.H, 1.I, 1.J, 1.L, 1.M, 1.N, and 1.O!In class or as homework, students must assess, analyze, graph, calculate, and interpret data regarding psychological studies. All questions are original, and modeled after the College Board format and difficulty. After learning about the topics in class, these are
Subjects:
Grades:
8th - 12th, Higher Education, Adult Education, Staff
Types:
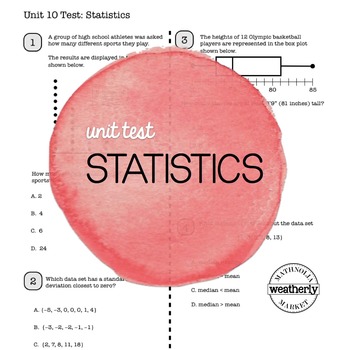
STATISTICS Unit Test CC Algebra 1
The Algebra I Common Core Unit Test will assess your students’ understanding of STATISTICS
Included topics:
Graphical Displays
Quartiles
Box Plots
Measures of Central Tendency
Variation
Two Way Frequency Tables
BiVariate Data
Linear Regression
Quantifying Predictability
Residuals
This assessment can serve as a test at the end of the unit, as a diagnostic tool prior to teaching the topics or as a “test prep” activity prior to state testing.
CCSS addressed:
N-Q.1
S-ID.1
S-ID.2
S-ID.3
S-ID.5
Subjects:
Grades:
9th - 12th
Types:
CCSS:
Also included in: Algebra 1 assessments - UNIT TEST BUNDLE
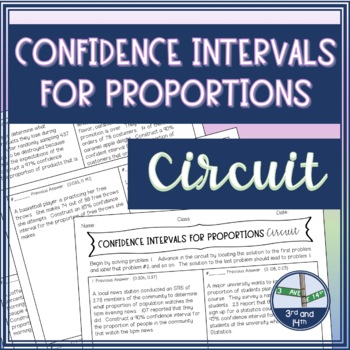
Confidence Intervals for Proportions Circuit Activity
Students will practice constructing confidence intervals for proportions. This activity requires no prep - just print, copy and go!What is a circuit? Students begin at question #1, solve the problem then look for the answer on the worksheet. When they find the answer to #1, they label that problem #2, and so on. The answer to the last problem will lead them back to #1. This provides a self-checking component.What's Included:12 problems asking students to construct confidence intervals for propo
Subjects:
Grades:
9th - 12th
Types:
CCSS:
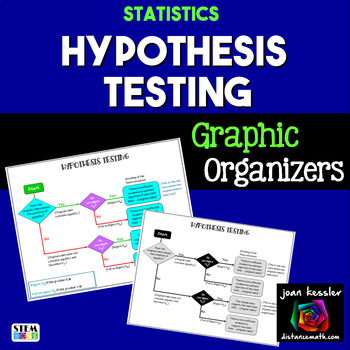
AP Statistics Hypothesis Testing Graphic Organizer
This Hypothesis Testing Graphic Organizer will help your students analyze and determine the correct wording for the results of a Hypothesis test. There are two versions of the organizers, one with H1 notation and the other with HA notation for the alternative Hypothesis. The preview only shows H1.There are five formats for the each of the version: Black and White, Color, with and without p -value info for rejection, and a two-to-a-page version as a paper saver. Please zoom in on the preview t
Subjects:
Grades:
9th - 12th
CCSS:
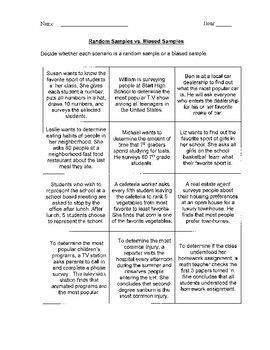
Random or Biased Sample? (Activity/Practice)
This resource can be used as a class activity or individual practice worksheet. Students are given 12 situations to analyze, and they must decide whether each of them represents a random sample or a biased sample. If being used as a class activity, students should cut out the squares (each situation is on one square). They can then tape them onto the board (have the board divided into 2 categories) based on what kind of sample they believe it is. As a class, you can then discuss each situati
Subjects:
Grades:
3rd - 12th
Types:
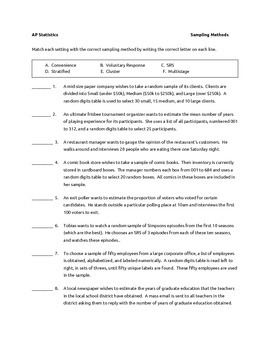
AP Statistics - Sampling Method Matching
Students will read eight different examples of sampling plans and match whether they are classified as a simple random sample (SRS), stratified random, cluster, voluntary response, convenience, or multi-stage.
Would make a great warm-up or would make for great small group discussion.
Two pages, including the answer key.
Subjects:
Grades:
11th - 12th
Types:
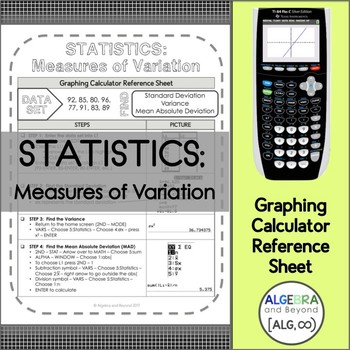
Statistics | Measures of Variation | TI-84 Graphing Calculator Reference Sheet
This graphing calculator reference sheet on measures of variation guides students step-by-step on how to create a list and find the standard deviation, variance, and mean absolute deviation.Teaching graphing calculator skills help students with: • Speed• Making connections• Checking for accuracy• Leaping hurdles*Reference sheet can be used with a TI-83 or TI-84 graphing calculator. Please look at the preview to find out more information about this resource.Check out more graphing calculator shee
Subjects:
Grades:
10th - 12th
Types:
CCSS:
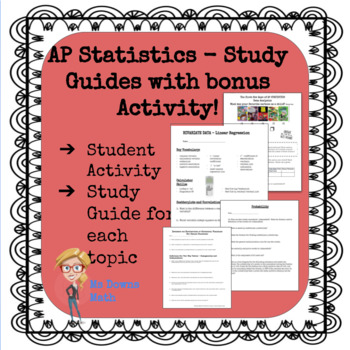
AP Statistics Study Guides - All Topics!
There is a pdf file study guide for each topic in the AP Statistics curriculum. Exploring Data, Normal Distributions, Linear Regressions, Experiments and Designing Studies, Probability, Random Variables, Sampling Distributions, Confidence Intervals, Hypothesis Tests, Comparing Populations, Chi Square Procedures, and Inference about Regression. I have students complete one for each unit. At the end of the year, they have a great study packet for the AP Exam! Student feedback has indicated that th
Subjects:
Grades:
9th - 12th, Higher Education, Adult Education
Types:
CCSS:
Showing 1-24 of 860 results


