Using the TI-84 Plus CE Graphing Calculator to Study Statistics
- PDF
Description
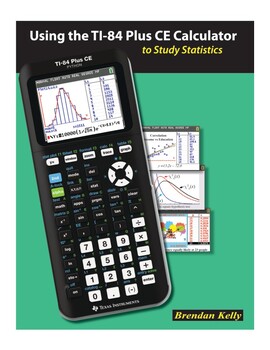
Using the TI-84 Plus CE Calculator to Study Statistics
ISBN 978-1-895997-59-0
(102 pages; 8.5” x 11” trim size)
The information age has made statistics one of the most important branches of mathematics. The ubiquity of real-world data enables us to explore statistical concepts using real data from interesting and current sources. As they work through the exercises in this book, students enter real data onto spreadsheets or into statistical plots on the TI-84 Plus CE Calculator while you guide their learning and help them draw appropriate inferences. Keying sequences guide them through the labyrinth of statistics menus on the TI-84 Plus CE without the need for them to page through the calculator manual. Full-color screen displays show a variety of different graphs in distinguishable colors.
Detailed solutions at the back of the book help students over obstacles to their learning and the application of various statistical techniques accessible on the TI-84 Plus menus and submenus are absorbed with minimal effort as the concepts of statistics are explored. Programs are included to perform experiments such as those applied in Monte Carlo investigations. Historical vignettes are included to add a human dimension to the mathematical excursions.
The topics included are statistical inference, data graphs, central tendency, measures of dispersion, correlation, regression lines, statistical distributions such as the normal distribution, the Central Limit Theorem, sampling, Monte Carlo methods, confidence intervals and hypothesis testing. The probability density functions for the binomial, normal, t, Chi Square and F distributions are defined and their properties are explored in terms of their application to tests of hypotheses. Exciting explorations in sampling techniques and inference, include simple programs for statistical simulations involving coin and dice tossing experiments. Correlations linking the content in this book to the Common Core State Standards are provided on page 6 of this book. To challenge your best students, we have included some content that reaches slightly beyond the typical high school curriculum and touches on topics found in advanced placement courses or community college.


