TPT
Total:
$0.00

AP Statistics Study Guides - All Topics!

Rated 4.56 out of 5, based on 9 reviews
4.6 (9 ratings)
;
MsDowns Math
31 Followers
Grade Levels
9th - 12th, Higher Education, Adult Education, Homeschool
Subjects
Standards
Formats Included
  • Zip
$19.99
List Price:
$24.00
You Save:
$4.01
Bundle
$19.99
List Price:
$24.00
You Save:
$4.01
Bundle
Share this resource
Report this resource to TPT
MsDowns Math
31 Followers

What educators are saying

This was a perfect way to review all the topics we covered in Statistics. It was great because it created something that they can study from for the upcoming test.

Products in this Bundle (12)

    showing 1-5 of 12 products

    Bonus

    AP Statistics Starter Activity

    Description

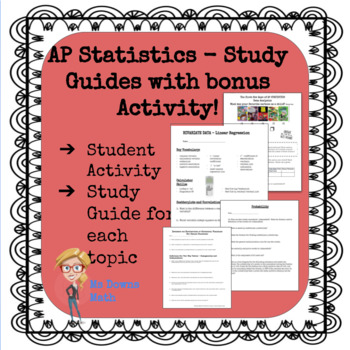
    There is a pdf file study guide for each topic in the AP Statistics curriculum.

    Exploring Data, Normal Distributions, Linear Regressions, Experiments and Designing Studies, Probability, Random Variables, Sampling Distributions, Confidence Intervals, Hypothesis Tests, Comparing Populations, Chi Square Procedures, and Inference about Regression. I have students complete one for each unit. At the end of the year, they have a great study packet for the AP Exam! Student feedback has indicated that these are very helpful for preparing for unit tests and the AP exam. You can see a preview by looking at the individual listings for each unit.

    I am new to TPT, so any input is greatly appreciated. I have, however, been teaching AP Statistics for more than 10 years. I have plenty of resources and plan on growing my TPT store this year.

    I also included a bonus activity that I use on the first couple of days of school. My students have summer work that requires them to complete the first unit, so we review using this activity. It is a lot of fun and gets the kids engaged right from the start!

    Total Pages
    Answer Key
    Included
    Teaching Duration
    N/A
    Report this resource to TPT
    Reported resources will be reviewed by our team. Report this resource to let us know if this resource violates TPT’s content guidelines.

    Standards

    to see state-specific standards (only available in the US).
    Represent data with plots on the real number line (dot plots, histograms, and box plots).
    Use statistics appropriate to the shape of the data distribution to compare center (median, mean) and spread (interquartile range, standard deviation) of two or more different data sets.
    Interpret differences in shape, center, and spread in the context of the data sets, accounting for possible effects of extreme data points (outliers).
    Use the mean and standard deviation of a data set to fit it to a normal distribution and to estimate population percentages. Recognize that there are data sets for which such a procedure is not appropriate. Use calculators, spreadsheets, and tables to estimate areas under the normal curve.
    Summarize categorical data for two categories in two-way frequency tables. Interpret relative frequencies in the context of the data (including joint, marginal, and conditional relative frequencies). Recognize possible associations and trends in the data.

    Reviews

    Questions & Answers

    31 Followers