148 results
Adult education statistics handouts
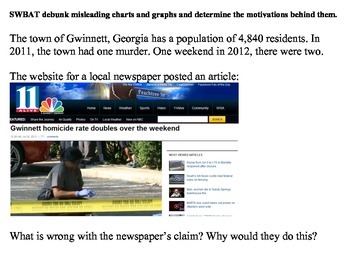
Misleading Charts and Graphs (Statistics)
Teaching students to deduce information provided in charts and graphs is an essential part of any math curriculum.
However, what do you do when the graph itself provides misleading or false information?
This lesson is a good way to get students to look critically at graphically displayed data and see through those who try to manipulate data for their own purposes.
Subjects:
Grades:
7th - 12th, Higher Education, Adult Education
Types:

AP Psych / AP Psychology - Unit 1: Scientific Foundations - Activity Pack!
Includes the wildly popular ESCAPE ROOM Activity, as well as analyzes and practices nearly all standards regarding Unit 1: Scientific Foundations of Psychology, including 1.B, 1.C, 1.E, 1.F, 1.G, 1.H, 1.I, 1.J, 1.L, 1.M, 1.N, and 1.O!In class or as homework, students must assess, analyze, graph, calculate, and interpret data regarding psychological studies. All questions are original, and modeled after the College Board format and difficulty. After learning about the topics in class, these are
Subjects:
Grades:
8th - 12th, Higher Education, Adult Education, Staff
Types:
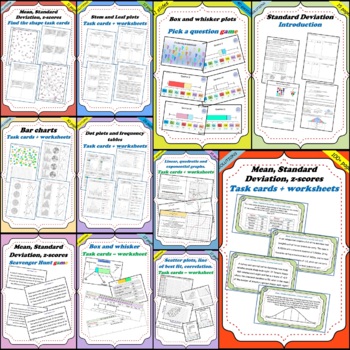
Statistics and charts + Statistics data distribution BUNDLE (450 pages)
This is a bundle package of all of my "Statistics and charts" AND MY "Statistics data distribution" products for a reduced price. This includes a total of 11 products:Statistics and charts:Bar charts, histograms and Circle graphs (1 product, 32 pages).Frequency tables and dot plots (1 product, 28 pages).Stem and leaf plots (1 product, 14 pages).Statistics data distribution:Quartiles and Box and whisker plots (2 products, , 28 pages + 41 slides).Mean, Standard Deviation, z-scores (4 products, 237
Subjects:
Grades:
10th - 12th, Adult Education
Types:
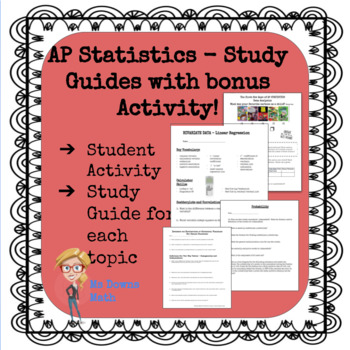
AP Statistics Study Guides - All Topics!
There is a pdf file study guide for each topic in the AP Statistics curriculum. Exploring Data, Normal Distributions, Linear Regressions, Experiments and Designing Studies, Probability, Random Variables, Sampling Distributions, Confidence Intervals, Hypothesis Tests, Comparing Populations, Chi Square Procedures, and Inference about Regression. I have students complete one for each unit. At the end of the year, they have a great study packet for the AP Exam! Student feedback has indicated that th
Subjects:
Grades:
9th - 12th, Higher Education, Adult Education
Types:
CCSS:
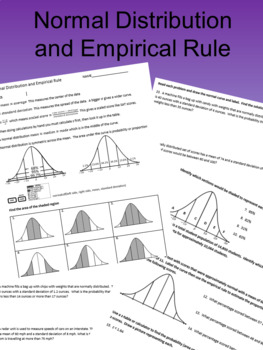
Normal Distribution and Empirical Rule Revised
This is a new and improved version of an older but popular product of mine Normal Distribution and Empirical Rule . It includes notes on the normal distribution with cleaner graphics and all new problems:It then includes 6 problems where they use the empirical rule to estimate the shaded region from a picture. Then 4 problems where they select the regions to give a desired area. A word problem where they label the curve and solve using normal distribution. The second side contains 4 problems wh
Subjects:
Grades:
9th - 12th, Higher Education, Adult Education
Types:
Psychology Random Sample Population Stats M&M Worksheet for Research Methods
Psychology or Statistics Random Sample & Population Statistics M&Ms Worksheet Activity for Research Methods includes a teacher direction sheet with materials that you need and how to complete the activity along with printable handout for students. *Student Favored activity*Please email me with any questions at ReadySetLearnSocialScience@yahoo.comIf you would like to get updates on NEW and CURRENT resources...►FOLLOW Me on Teachers Pay Teachers►FOLLOW Me on Pinterest►FOLLOW Me on Instagr
Subjects:
Grades:
4th - 12th, Adult Education
Types:
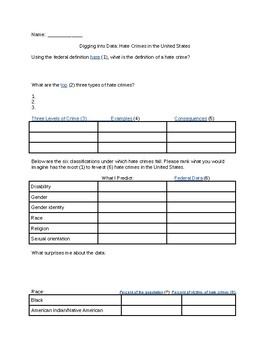
The 57 Bus- Looking at Hate Crime Data
A guided web search on hate crime data from the FBI, CDC, Pew Research Center, and U.S. Census Bureau. Uses reflection questions to make conclusions and predictions about the distribution of hate crimes. The kids are fascinated by the data!
Subjects:
Grades:
7th - 12th, Higher Education, Adult Education
Types:
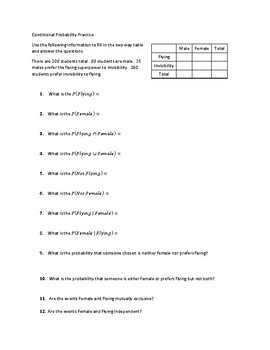
Conditional Probability Practice
This worksheet includes 18 problems with conditional probability, probability from a two way table, probability from a tree diagram, includes intersection, discusses mutually exclusive events and independent events.
Subjects:
Grades:
9th - 12th, Higher Education, Adult Education
Types:

La famille- Infographie- Family Trends- AP French (intermediate to advanced)
In the resource file, you will find 12 infographic sheets on the topic of family trends for students of French (intermediate to advanced) + a test (and answers). All facts and statistics are linked to France. These can be used for flipped learning, revision material, independent study etc…The resource comes as a 15 pages booklet (including the content page) as well as 14 files for single pages, should you wish to send specific aspects to your students.Please note: The sheets are in .pdf format a
Subjects:
Grades:
9th - 12th, Higher Education, Adult Education
Types:

Misleading Statistics
Did you know that 90% of all serial killers are right-handed?
Well, of course... 90% of all people in general are right-handed.
This is a great activity that can be used as an introduction to any statistics class or unit. It makes students think about how people misinterpret statistics and how two people can look at the same data and draw different conclusions.
Subjects:
Grades:
7th - 12th, Higher Education, Adult Education
Mean, Median, Mode, Range, Outlier, Quartiles, Box and Whisker Plots
Definitions, examples, and problems to help students learn the concepts and remember them!
Concepts presented:
• Mean
• Median
• Mode
• Range
• Outlier
• Quartiles, Box-and-Whisker Plots
The worksheets include: 3 pages of definitions and examples, 3 pages of problems, and 3 pages of solutions.
******************************************************************
Feedback → TpT Credits → Discount on a future purchase!
After you purchase and review a product, you will be given a chance to prov
Subjects:
Grades:
7th - 9th, Adult Education
Types:
Graphic Organizers for Statistics - ALL THREE PARTS
This is a combined package of all three parts of my Graphic Organizers for Statistics. It includes all the organizers from
Part I: Descriptive Statistics,
Part II: Sampling & Probability, and
Part III: Inferential Statistics.
Please see the individual products for more info.
Subjects:
Grades:
11th - 12th, Higher Education, Adult Education
Types:
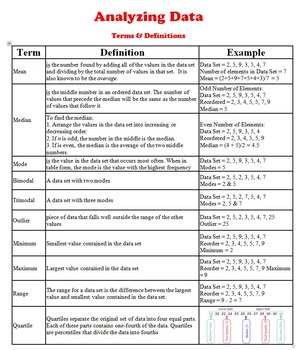
Data Analysis - Terms & Definitions (statistical measures definitions)
This Handout is part of : Maze - BUNDLE Statistical Measures (Mean, Median, Mode, & Range)
This handout is a quick reference sheet which includes the main definitions needed to introduce the data analysis terms in statistics. Terms such as: mean, median, mode, bimodal, outlier, minimum, range, quartile, box-and-whisker,.... etc. are some of the definitions shared on this handout.
Share it with your students, test them on it, and expect them to know it by heart. Those definitions are the
Subjects:
Grades:
6th - 12th, Higher Education, Adult Education
Types:

Mission 2: Backwards Averaging
This packet asks students to go on a mission to help the monsters at Peace University know where best to spend their time studying for exams. Three monsters reveal the grades they have made in each of their four classes and ask the student to find out what is the minimum grade they would need to make on each subject's exam in order to get a 90% (an A) in all of their classes.As part of the instructions for the quest, a secret for solving these types of problems is revealed. As it is explained
Subjects:
Grades:
6th, Adult Education
Types:
CCSS:
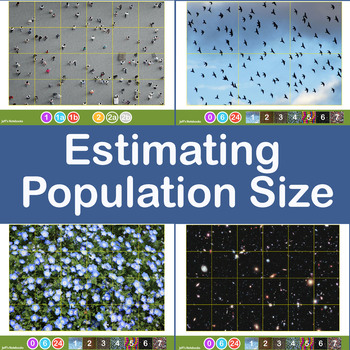
Estimating Crowd and Population Size using Jacob's Method
This investigation delves into estimating the size of a large population of objects by taking a sample and applying some basic mathematics. It encourages sharing of data, refining methods of collection of the data and discussion about the accuracy and limitations of the method used.Jacob's Method of counting large numbers of objects is simple. Draw a grid dividing the area covered into equal size squares. Estimate (by counting) the population of one grid then multiply this by the number of squar
Subjects:
Grades:
6th - 11th, Higher Education, Adult Education
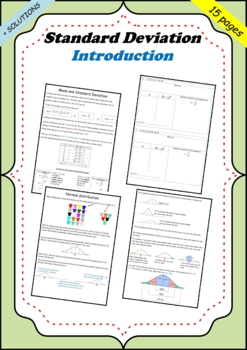
Introduction to Standard Deviation
This is an introduction to standard deviation, covering the following topics:• Mean and standard deviation.• Standard deviation for a sample and a population.• Normal distribution and the bell curve.• Effect of the standard deviation on the bell curve.• Empirical rule : 68 – 95 – 97.7 rule.• Standard normal disribution.• Z – scores.Suggested solutions to all questions are included.PLEASE NOTE: this product is also available in my Algebra 1 packet, please click below:"Algebra 1 Complete Course Cu
Subjects:
Grades:
10th - 12th, Adult Education
Types:
Also included in: Statistics and charts + Statistics data distribution BUNDLE (450 pages)
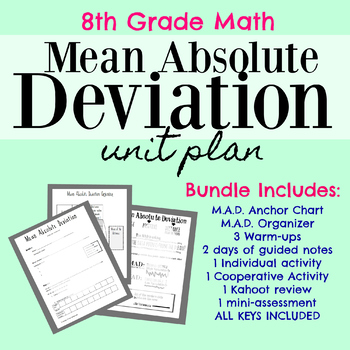
Mean Absolute Deviation Bundle
***NOW WITH DAILY TEACHER GUIDE FOR EASY IMPLEMENTATION***
This purchase also includes exclusive access to the highly rated MAD Anchor Chart!
This is the perfect unit bundle to teach Mean Absolute Deviation in a way that the students will understand and ENJOY! This unit proved very effective according to last year's STAAR scores. Included:
M.A.D. organizer to laminate or print!
3 Warm-ups
2 days of guided notes
1 individual activity
1 Cooperative Activity
1 Kahoot review
1 mini-assessment
ALL
Subjects:
Grades:
7th - 12th, Higher Education, Adult Education
Types:
IB Biology Complete Guide to Statistical Analysis - Student Guide
This guide includes all statistical analysis techniques required for completion of IB Biology, both higher level and standard level. The PDF guide includes explanations of each test as well as how to run the analysis by hand and using spreadsheet software. Tests include: simple statistics, standard deviation, coefficient of variation, Student's T-Test, ANOVA, correlation, regression, and Chi-Square.
Grades:
9th - 12th, Higher Education, Adult Education
Types:
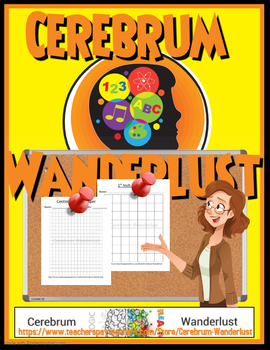
Centimeter & 1 Inch Grid Papers (Full Sheets Each)
A full sheet of Centimeter Grid Paper and a full sheet of 1 inch Grid Paper all contained in one easy to transport/store .pdf. You can use these sheets with making charts, plotting points, etc... Enjoy and thank you for your support.
Subjects:
Grades:
PreK - 12th, Higher Education, Adult Education, Staff
Types:
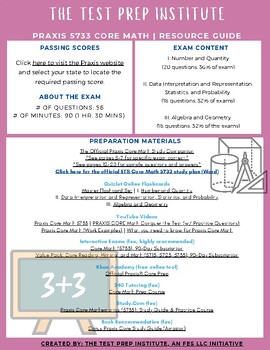
Praxis Core Math 5732 or 5733 Exam | Resource Guide
Greetings from Team TPI!We are excited to offer custom resource guides for education majors and novice teachers working to earn their teaching license. The document includes a list of resources available online for your exam. Some resources are free and others require a fee. Your purchase includes a free 30-day subscription to 240Tutoring.com! Please email info@thetestprepinstitute.com after your purchase to retrieve your subscription. Please note, this document is for individuals who are not
Subjects:
Grades:
7th - 12th, Higher Education, Adult Education, Staff
Types:
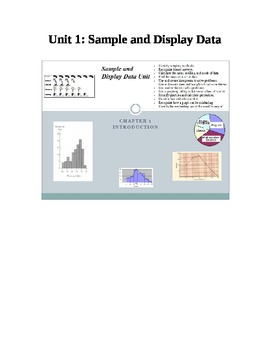
Sample and Display Data Unit
Sample and Display Data Unit
Includes learning objectives, vocabulary sheets, pre-test, test and retest.
Covers:
- Identify sampling methods.
- Recognize biased surveys.
- Calculate the mean, median, and mode of data.
- Find the range of a set of data.
- Use and create histograms to solve problems.
- Use and create stem and leaf plots to solve problems.
- Use scatter plots to solve problems
- Use a graphing utility to determine a line of best fit.
- Identify quartiles and calculate percentil
Subjects:
Grades:
5th - 12th, Higher Education, Adult Education, Staff
Types:

Hypothesis Test for a Population Proportion - Analogy to a Criminal Trial
This is a student workbook that can supplement lessons on hypothesis testing for a population proportion.I teach the stages of hypothesis testing using analogies to a criminal trial. My students like this comparison; they are more engaged and it helps them to see the relevance of the different stages. Once students are confident with the terminology, we create our own courtroom in the classroom and role-play the stages of hypothesis testing with students acting as the jury, prosecution, judge an
Subjects:
Grades:
9th - 12th, Higher Education, Adult Education
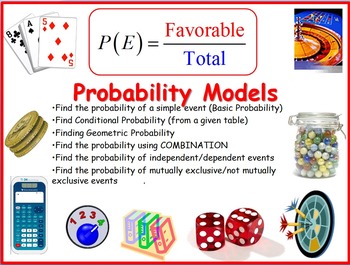
Probability Models
This handout drills the understanding of the different models of probability. Student would have to first determine under which model should this problem fit, then, apply the appropriate strategy to answer the questions. There are many ways to answer each of the questions provided in this handout. I provided "An" answer key.
In this handout, you will find a set of 40 questions on the following probability models:
1. Detailed visual description of the Standard Deck of Cards
2. Basic Probab
Subjects:
Grades:
6th - 12th, Higher Education, Adult Education, Staff
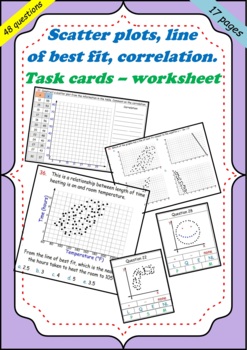
04 Scatter plots, line of best fit, correlation-intro + worksheet (48 questions)
This an introduction to scatter plots, line of best fit and correlation, with practice questions. The terms are explained with worked out examples. Methods are used to explain how to interpret scatter plots, line of best fit and correlation.There is also a picture of scatter plots that can be used as a poster (especially if printed in A3) or given to students as cover pages for their journals.This worksheet covers the following topics:• Correlation, including: - Positive, negative or no corr
Subjects:
Grades:
10th - 12th, Adult Education
Types:
Also included in: Statistics and charts + Statistics data distribution BUNDLE (450 pages)
Showing 1-24 of 148 results


