10 results
Higher education statistics simulations

Normal Distribution in a real life context: Lake Tekapo Fish Mongers
Are you having trouble explaining what Normal distribution is and how it can be used in real life? Are your students craving a hands on activity that would make sense of this concept? Do you need an engaging project on statistics? Would you like an activity that already has enrichment, scaffolding and all of the material ready to go? If you answered yes to any or all of these questions, this project is tailor made for you!Your students will assume a role of a research team for a fishing company.
Subjects:
Grades:
10th - 12th, Higher Education
Types:
CCSS:
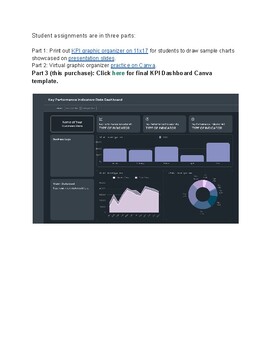
Key Performance Indicators Data Dashboard - Final Project
Student assignments are in three parts:Part 1: Print out KPI graphic organizer on 11x17 for students to draw sample charts showcased on presentation slides.Part 2: Virtual graphic organizer practice on Canva.Part 3 (this purchase): Final KPI Dashboard Canva template.
Subjects:
Grades:
8th - 12th, Higher Education, Adult Education
Types:
Also included in: Key Performance Data Dashboards Bundle
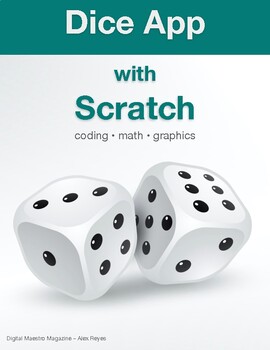
Dice game and app with Scratch (Distance Learning)
In these lessons, you will learn how to create a dice game with Scratch. The game is useful as a random number generator. It is useful when teaching randomness and probability. Students learn coding skills. Students learn to create their own dice face with a free online graphics application. Each lesson comes with detailed step by step instructions.
Grades:
2nd - 12th, Higher Education, Adult Education, Staff
Types:
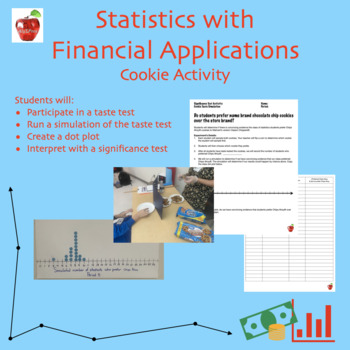
Cookie Simulation Activity - Statistics with Financial Applications
In this activity students will participate in a taste test to gather real data then run a simulation for the same experiment to determine if there is statistically significant evidence that students prefer Chips Ahoy cookies over an off-brand. Students will also answer questions and create a dot plot using the data.
Subjects:
Grades:
9th - 12th, Higher Education, Adult Education
Types:
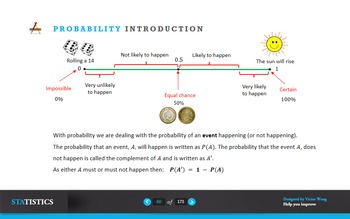
Probability
• evaluate probabilities in simple cases by means of enumeration
of equiprobable elementary events (e.g. for the total score when
two fair dice are thrown), or by calculation using permutations or
combinations;
• use addition and multiplication of probabilities, as appropriate, in
simple cases;
• understand the meaning of exclusive and independent events,
and calculate and use conditional probabilities in simple cases,
e.g. situations that can be represented by means of a tree diagram.
Subjects:
Grades:
Higher Education, Staff
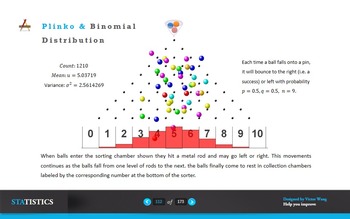
Binomial Distribution
• use formulae for probabilities for the binomial distribution, and
recognise practical situations where the binomial distribution is a
suitable model (the notation B(n, p) is included);
• use formulae for the expectation and variance of the binomial
distribution.
Subjects:
Grades:
10th - 12th, Higher Education, Staff
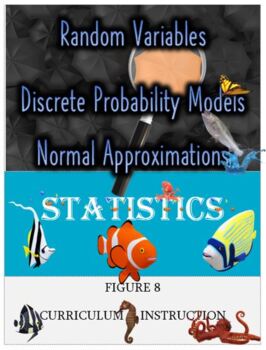
Snack Cakes: Group Task Random Variables_Discrete Var_Normal Approx. (editable)
Group Task Involving CAKE!!!!Targeted Skills:1. Interpret Statistical Calculations2. Determine Models and Parameters3. Assign Meanings and Assess Claims4. Determine Calculations Targeted Topics:1. Random Variables and Combinations2. Probability Distributions-Binomial and Geometric3. Mean and Standard Deviation of Random Variables4. Normal Approximations for Binomial DistributionsWhat is Included in this document?1. Task2. Sample Solution with Point Values and Scoring Guide3. Directions for imple
Subjects:
Grades:
9th - 12th, Higher Education, Adult Education
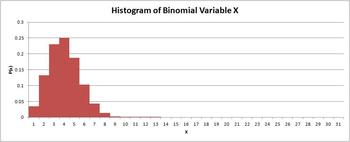
Normal Approximation to the Binomial Demonstration
This interactive Excel worksheet uses a histogram to demonstrate to students the conditions under which a normal distribution can be used to approximate binomial probabilities. Users can change the values of n and p, and the histogram will update automatically. The binomial probabilities are also updated with each change. Students will be able to clearly see when the histogram approaches a mounded and symmetric distribution. The bars of the histogram are wide enough for students to be able t
Subjects:
Grades:
9th - 12th, Higher Education
Types:
Simulation Intro Activity for AP Statistics (or lower)
This activity can be used to kick-off a statistics course or used later when introducing simulation as part of a probability unit. The theme is that names were randomly drawn out of a hat to see which students will have their paintings included in an art show. When a significant amount of females were selected, some of the males cried discrimination! So this problem has students discuss different ways to carry out a simulation (use a deck of cards, a random number generator, or a table of ran
Subjects:
Grades:
9th - 12th, Higher Education
Types:
CCSS:
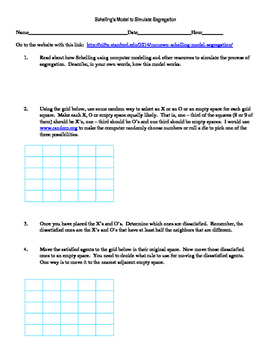
Schelling Model of Segregation using McCown's Simulation
This mini problem focuses on using models to simulate a known event. The questions emphasize having students make observations about the outcomes of a model.
Subjects:
Grades:
10th - 12th, Higher Education
Types:
Showing 1-10 of 10 results


