Misleading Charts and Graphs (Statistics)
David Prince
29 Followers
Grade Levels
7th - 12th, Higher Education, Adult Education
Subjects
Resource Type
Formats Included
- PDF
Pages
12 pages
David Prince
29 Followers
Description
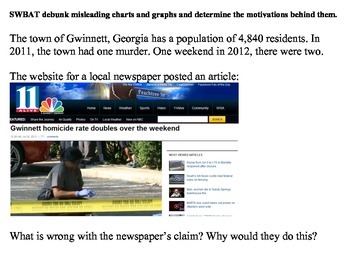
Teaching students to deduce information provided in charts and graphs is an essential part of any math curriculum.
However, what do you do when the graph itself provides misleading or false information?
This lesson is a good way to get students to look critically at graphically displayed data and see through those who try to manipulate data for their own purposes.
However, what do you do when the graph itself provides misleading or false information?
This lesson is a good way to get students to look critically at graphically displayed data and see through those who try to manipulate data for their own purposes.
Total Pages
12 pages
Answer Key
Does not apply
Teaching Duration
45 minutes
Report this resource to TPT
Reported resources will be reviewed by our team. Report this resource to let us know if this resource violates TPT’s content guidelines.


