Estimating Crowd and Population Size using Jacob's Method
- Zip
Description
This investigation delves into estimating the size of a large population of objects by taking a sample and applying some basic mathematics. It encourages sharing of data, refining methods of collection of the data and discussion about the accuracy and limitations of the method used.
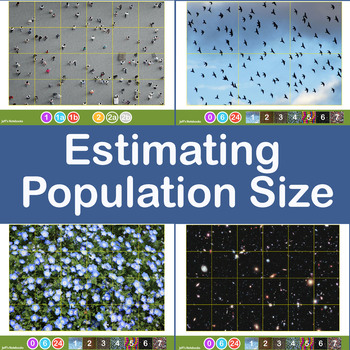
Jacob's Method of counting large numbers of objects is simple. Draw a grid dividing the area covered into equal size squares. Estimate (by counting) the population of one grid then multiply this by the number of squares in the grid.
What happens if you use different size grids ? How do the estimates compare ? What happens if you take all the estimates in the class and find the range and mean ? How close are they all to the real number ? These and many more questions are laid out on the worksheet provided along with a number of prepared pictures with & without grids for printing or viewing on a computer.
Content
Teachers Notes
An overview of Jacob's Method and a guide to the Worksheets
Estimation Worksheet
A guide for the students on how to use Jacob's Method and record the data.
A list of questions for discussion.
Estimation Crowds
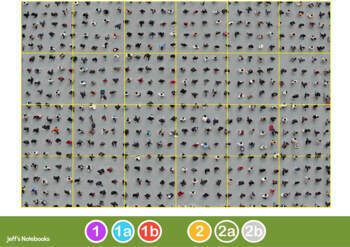
Designed to be used as a starter with the student's worksheet, it contains 2 crowds of different densities.
Pupils start with guessing the size of each crowd, then estimate with a 6 square grid & 24 square grid using Jacob's Method.
Estimation Samples 1 and 2
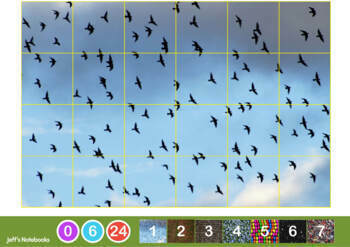
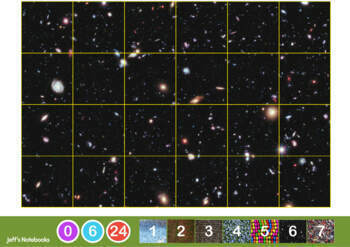
14 pictures to choose from: crowds, stars, trees, bricks, flowers, balloons, birds in flight and more.
Pupils estimate with no grid, a 6 square grid & 24 square grid, and are encouraged to experiment further with other grid sizes of their own.
Estimation Sample 3
7 more pictures to choose from, but this time the distribution of the populations are not so even or regular, so its more challenging and opens up more questions.
They include a football crowd, bubbles, two other crowds, a shoal of fish and a herd of wilderbeast.
In all, lots of examples to practice with & food for lively discussion and critical thinking using basic math and could be taken further into investigating bias in crowd counting.
Note: All the documents in this bundle are printable.
To view the sample populations with the grids on a computer you will need the Adobe Acrobat Reader on a PC or Mac.


