130 results
Higher education statistics projects
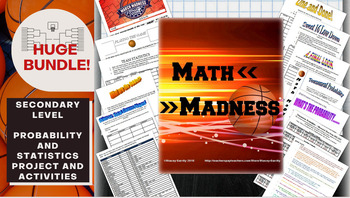
Math March Madness Full Tournament Project {BUNDLE}
Harness the excitement of NCAA March Madness with this huge project for secondary math teachers that follows all stages of the tournament! This Common Core aligned bundle comes with bonus parts not sold individually in my store so you can create a rich immersion in the tournament, practice probability and statistics and learn some interesting new ones along the way! Save $3 plus get bonus content by bundling!You can pick and choose which parts you would like to incorporate, or follow my schedu
Subjects:
Grades:
6th - 12th, Higher Education
Types:
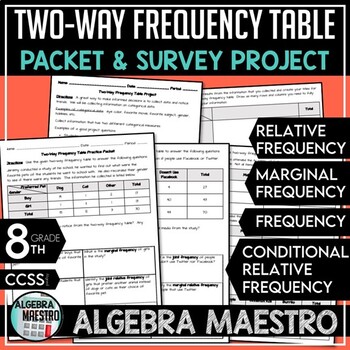
Two-Way Frequency Table Practice Packet & Project
With the Two-Way Frequency Table (or two way tables) Practice Packet & Project you'll receive:-3 pages of student practice via packet-3 pages of the answer key for the packet-2 pages for the student driven projectThe Two-Way Frequency Table Packet and Project are meant to be a review and reinforcement activity. Students can practice and further enhance their understanding using the Packet Practice. Teacher may want to further differentiate the content for advanced students and give them th
Subjects:
Grades:
7th - 12th, Higher Education, Adult Education
Types:
CCSS:
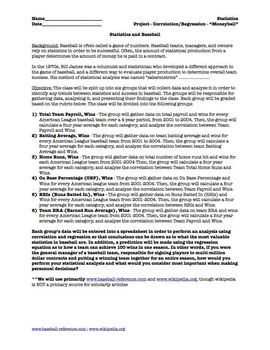
Statistics Correlation and Regression Project for Movie "Moneyball" (5 day)
Prerequisite: Correlation and Regression (Linear). This is a project that divides a statistics class into 6 groups and students do ACTUAL data collection from given websites and they perform their OWN ANALYSIS. They will use computers/internet/excel/spreadsheets/graphing calculators to evaluate correlation. If you have interest in baseball and statistics, this is a great project to get the class interested, and covers about 5 days, plus you can watch the movie "Moneyball" afterwards as a reward.
Subjects:
Grades:
10th - 12th, Higher Education, Adult Education
Types:
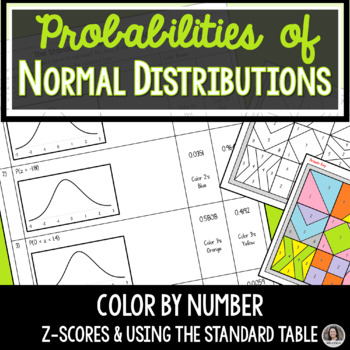
Probabilities of Normal Distribution, Z Scores Activity Project
Students shade the area under the normal distribution curve and determine the probabilities for the given z-scores in this color by number activity. Their answers will determine what color they will need to use to color the provided image. This self-checking activity allows students to work independently to practice their understanding of using The Standard Table to determine probabilities of normal distributions.The color by number activity can be assigned in a variety of ways. 1. Assign The S
Subjects:
Grades:
6th - 12th, Higher Education
Types:
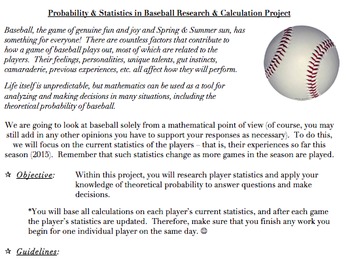
Probability & Statistics in Baseball Project (Common Core Aligned, AND FUN!)
The problems and activities within this document are designed to assist students in achieving the following standards: 6.SP.B.5, 7.SP.C, HSS.CP.A.2, HSS.CP.A.3, HSS.CP.B.7, HSS.CP.B.9, as well as the standards for mathematics practice and the literacy standards. They are also designed to help the teacher assess the students’ abilities when it comes to working with the ideas within the standards.This document contains the following:A project designed to allow students to investigate theoretical
Subjects:
Grades:
5th - 12th, Higher Education, Adult Education, Staff
Project-Based Learning, PBL | High School Math (AP Statistics)
Spark Student Interest in Real-World Statistics with Scienovate's AP Statistics Project-Based Learning Bundle!Are you an educator, homeschool parent, or high school student looking for engaging ways to apply AP Statistics concepts to real-world challenges? Look no further than Scienovate's Project-Based Learning Projects Bundle for AP Statistics!This comprehensive bundle goes beyond traditional theoretical projects, offering a unique set of Project-Based Learning (PBL) activities specifically de
Subjects:
Grades:
9th - 12th, Higher Education, Adult Education
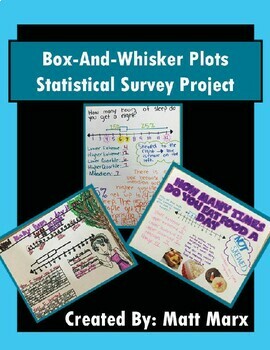
Box And Whisker Plots - Statistical Survey Project
Box-And-Whisker Plots - Statistical Survey ProjectThis Statistical Survey Project offers students the opportunity to demonstrate an understanding of Statistics content through the lens of a personalized statistical survey and the creation/study of a Box-And-Whisker Plot.Students insert themselves into their learning by selecting their own personalized survey question. Students have fun creating their posters, sharing them with the class, and having them displayed for all to see in the classroom.
Subjects:
Grades:
6th - 12th, Higher Education, Adult Education
Types:
CCSS:
Project-Based Learning, PBL | High School Math (Statistics)
Spark Curiosity and Ignite Future Scientists with Award-Winning Project-Based Learning (PBL) in Statistics!Are you an educator, homeschool parent, or student looking for engaging, real-world PBL experiences that go beyond the typical "science fair volcano"? Look no further than the Scienovate Science Fair Projects Bundle for High School!This comprehensive bundle throws away the tired, superficial activities and dives headfirst into the powerful application of Statistics in solving critical chall
Subjects:
Grades:
9th - 12th, Higher Education, Adult Education
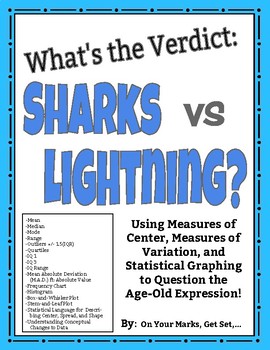
What's the Verdict: Sharks vs. Lightning? Modes of Center, Spread, and More!
Put it to the test! Use the age-old expression: "You are more likely to get struck by lightning than to be bitten by a shark!" to learn and practice Measures of Center, Measures of Spread, Measures of Shape, and Statistical Graphing including:MEANMEDIANMODERANGEOUTLIERS [Using IQR +/- 1.5(IQR)]QUARTILES [lower quartile (IQ-1) and upper quartile (IQ-3)]INTERQUARTILE RANGE (IQR)MEAN ABSOLUTE DEVIATION/ M.A.D. ft. ABSOLUTE VALUESYMMETRY/ASYMMETRY OF DISTRIBUTIONCLUSTERS AND GAPSBELL SHAPED CURVE AN
Subjects:
Grades:
5th - 12th, Higher Education, Adult Education
Types:
Create Your Own Statistics Project
This document contains a statistics project description that allows students to create their own project. This is suitable for high school and beginning level college statistics class. Students will design their own study - formulate research questions, collect data, organize and summarize the findings, calculate confidence interval and construct hypothesis testing. Certain restrictions are outlined in the document. Students will experience the complexity of constructing their own study. They ar
Subjects:
Grades:
10th - 12th, Higher Education, Adult Education
Types:
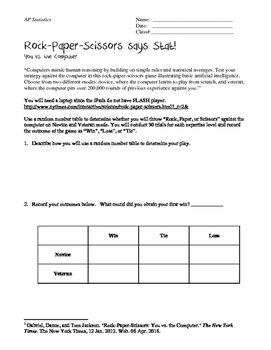
Rock, Paper, Scissors says Stat: A Chi-Square Lab
Students will utilize a Rock, Paper, Scissors website provided by the New York Times to determine whether the computer throwing Rock, Paper, Scissors is truly random. Students are asked to play the game 30 times in both modes. In addition, students are asked to call back ideas of simulation and probability to review previous learned concepts in preparation for the AP Exam to eliminate the confounding variables associated with human behavior.Please find an updated link to the simulator here: ht
Subjects:
Grades:
9th - 12th, Higher Education
Types:
Statistics Final Project Bundle
This is the complete Statistics Final Project that I have used with my students for two years now. It includes a beginning Survey Worksheet, where students create a question and survey one another for data. Then, it also includes a self reflective rubric and a Google Slides presentation template. This project overall is a major hit, and students feel a great sense of accomplishment, especially when framing it as a long term, multi-step process.
Subjects:
Grades:
5th - 12th, Higher Education
Types:
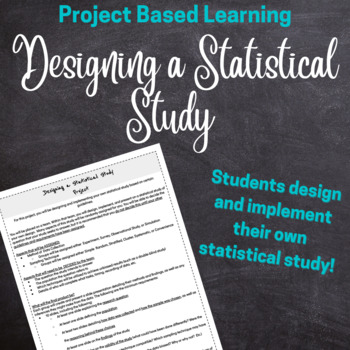
Statistics Project Design and Implement a Statistical Research Study Project
Prove that your students know how a good statistical or research study is designed! In this project, students will be assigned a method of data collection (either Observational Study, Experiment, Survey, or Simulation) and a sampling technique (either cluster, stratified, simple random, systemic, or convenience) and will design their own research question and study. The goal is for students to develop a research question that works well with the method of collection and sampling technique they w
Subjects:
Grades:
11th - 12th, Higher Education, Adult Education
Types:

Normal Distribution in a real life context: Lake Tekapo Fish Mongers
Are you having trouble explaining what Normal distribution is and how it can be used in real life? Are your students craving a hands on activity that would make sense of this concept? Do you need an engaging project on statistics? Would you like an activity that already has enrichment, scaffolding and all of the material ready to go? If you answered yes to any or all of these questions, this project is tailor made for you!Your students will assume a role of a research team for a fishing company.
Subjects:
Grades:
10th - 12th, Higher Education
Types:
CCSS:
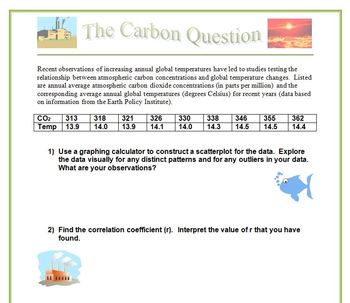
The Carbon Question: A Correlation and Regression Project
Is there a correlation between Atmospheric Carbon Dioxide and Global Temperature rise? If so, does that alone mean that increasing atmospheric carbon is causing increasing global temperatures?
An application of correlation and regression, this project will have your students:
1. Constructing a scatterplot from paired data
2. Calculating and interpreting a correlation coefficient
3. Conducting a hypothesis test for paired data
4. Constructing a Linear Regression Model
5. Testing observed data
Subjects:
Grades:
10th - 12th, Higher Education
Types:
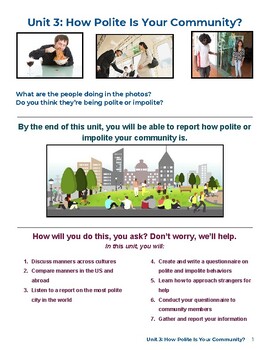
Project-based Unit on Polite/Impolite Behaviors
This project-based unit on polite behaviors is an engaging and interactive way for ESL students to build their communication skills. Other skills and systems are targeted in the unit, such as reading to make predictions and writing a hypothesis. Depending on the dynamics of the class and instructor, this unit can be completed in 1-2 weeks.Although students are expected to conduct surveys in public and present their findings, the tasks can be adapted to suit the class's comfort zones and needs. F
Grades:
9th - 12th, Higher Education, Adult Education
Types:
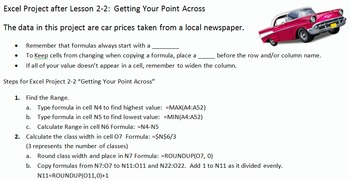
Excel Projects for Statistics Frequency Distributions and Charts
This file contains three different projects with solutions and a quick reference card for students. It correlates to Bluman's Elementary Statistics textbook.
First is an Introduction to Excel. There is an example, guided practice and then 4 Projects. The instructions are on each sheet. The topics covered are: basic editing and formatting, beginning charts, beginning formulas, such as SUM and AVERAGE, and calculations. There is an editable grading rubric for this project. The Preview file
Subjects:
Grades:
8th - 11th, Higher Education, Adult Education
Types:
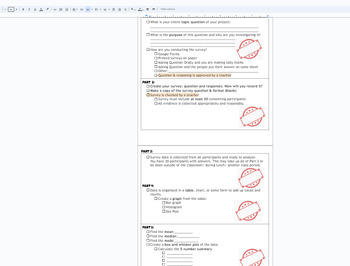
Statistics Survey project Discovery (broken down into sections) with Rubric
This is a broken down (scaffolded) packet of instructions/ guide for a Stats Project for Math 1 HS or 8th grade students. The goal of the project is for students to take a statistical survey on quantitative data (numbers) of their choice. Using this data from the survey, the following will be included in the project:Survey- the question being askedSurvey responses (requirement of 30)Data organization: Bar chart, Histogram, Dot PlotMeanMedianModeBox and Whisket Plot5 number summary (Q1,Q2,Q3, min
Subjects:
Grades:
7th - 12th, Higher Education, Adult Education
CCSS:

Project-Based Learning | High School Math (AP Statistics) | Fueling Efficiency
Fueling Student Success with AP Statistics: The RouteOpt+ Project-Based Learning ProjectAre you looking for an engaging and impactful way to introduce your students to the power of AP Statistics? Look no further than Scienovate's Fuel Efficiency: Can Route Planning Drive Down Costs for Mobile Food Vendors? Project-Based Learning Project (PBL)! This innovative PBL dives deep into the real-world challenge faced by mobile food vendors – rising fuel costs.Why Choose Scienovate's Fuel Efficiency Proj
Subjects:
Grades:
9th - 12th, Higher Education, Adult Education
Also included in: Project-Based Learning, PBL | High School Math (AP Statistics)
Project-Based Learning | High School Math (AP Statistics) | Signaling Safety
Signaling Safety: A Project-Based Learning Powerhouse for AP Statistics Champions!Calling all AP Statistics educators, homeschool parents, and aspiring scientists and engineers! Are you searching for a Project-Based Learning (PBL) experience that goes beyond theory and dives into the heart of real-world problem-solving? Look no further than Scienovate's Signaling Safety: Using AP Statistics to Predict and Prevent Railroad Trespassing project!Why Choose Signaling Safety?This meticulously crafte
Subjects:
Grades:
9th - 12th, Higher Education, Adult Education
Also included in: Project-Based Learning, PBL | High School Math (AP Statistics)

Project-Based Learning | High School Math (AP Statistics) | Streamlining Eff.
Unleash the Efficiency Hero Within: Introducing the Streamlining Efficiency - AP Statistics in Construction ProjectEmpowering Educators, Homeschool Parents, and the Next Generation of Problem-SolversIn today's dynamic world, Project-Based Learning (PBL) has become a cornerstone of effective education. But what if your PBL project could not only engage students but also equip them with the skills to tackle real-world challenges faced by industries like construction? Look no further than Scienovat
Subjects:
Grades:
9th - 12th, Higher Education, Adult Education
Also included in: Project-Based Learning, PBL | High School Math (AP Statistics)
Project-Based Learning | High School Math (AP Statistics) | Flying on Rentals
Soar Through AP Statistics with a Winning Project-Based Learning Experience: "Flying High on Rentals"Empower your students to become future aviation industry leaders! Scienovate presents "Flying High on Rentals: A Statistical Analysis of Aircraft Leasing and Airline Operations," a revolutionary Project-Based Learning (PBL) project designed to propel your students on an engaging exploration of AP Statistics principles within the dynamic world of air travel.More Than Theory: Real-World Applicatio
Subjects:
Grades:
9th - 12th, Higher Education, Adult Education
Also included in: Project-Based Learning, PBL | High School Math (AP Statistics)
Project-Based Learning | High School Math (AP Statistics) | Opioid By Numbers
Unveiling Patterns in Healthcare: A Real-World AP Statistics Project for High School SuccessEmpower Your Students to Become Citizen Statisticians with Scienovate's "Opioid By Numbers" Project-Based Learning (PBL) ProjectAre you searching for an engaging AP Statistics project that tackles a critical real-world challenge? Look no further than Scienovate's "Opioid By Numbers"! This comprehensive PBL project dives deep into the opioid epidemic in the United States, equipping high school students wit
Subjects:
Grades:
9th - 12th, Higher Education, Adult Education
Also included in: Project-Based Learning, PBL | High School Math (AP Statistics)
Project-Based Learning | High School Math (AP Statistics) | Loan Approvals
Dive Deep into Real-World Finance with Our "Optimizing Loan Approvals" AP Statistics Project-Based Learning Project!Are you searching for an engaging and practical AP Statistics Project-Based Learning Project (PBL) that empowers students to tackle a real-world challenge in the dynamic world of Finance and Insurance? Look no further than Scienovate's "Optimizing Loan Approvals: A Statistical Analysis of Streamlining Application Processes in Commercial Banking" project!This meticulously designed P
Subjects:
Grades:
9th - 12th, Higher Education, Adult Education
Also included in: Project-Based Learning, PBL | High School Math (AP Statistics)
Showing 1-24 of 130 results


