35 results
Not grade specific statistics handouts
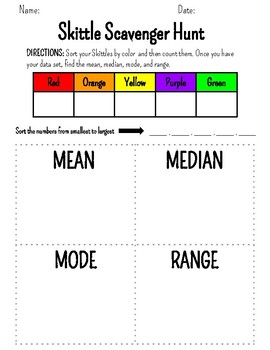
Mean, Median, Mode, and Range Skittle Activity
Have students practice mean, median, mode, and range using Skittles!
Subjects:
Grades:
Not Grade Specific
Types:
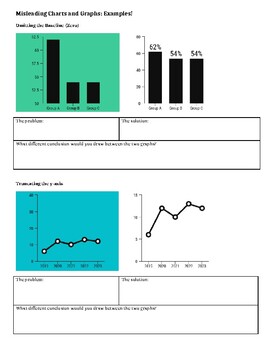
Misleading Charts and Graphs Analysis
This lesson outlines the four most common ways that writers and journalists display graphs that can cause people to draw incorrect conclusions. Students look at examples of bad graphs along with corrected versions and explain why one version is misleading and the other is correct. Independent practice is provided for the students to demonstrate understanding as well.
Subjects:
Grades:
Not Grade Specific
Types:

Adjustable Graph Templates
With Adjustable Graph Templates you'll receive a variety of graphs that are formatted to be easily adjustable, this is to help you create your own assignments. The full-page templates can be used as cut-outs, very useful for Foldables, and Interactive Notebooks. There are a variety of graph templates: coordinate axis (axes), 1st quadrant, number line, grid - and with a variety of units and sizes to suit your needs. To adjust a graph - click the desired graph and adjust the size by selecting-
Subjects:
Grades:
Not Grade Specific
Types:
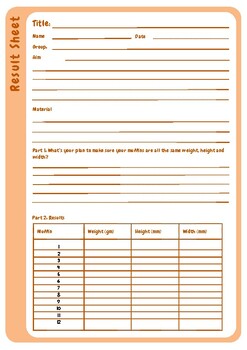
Consistency Confections: A Muffin-Baking Exploration in Product Quality
Embark on a delectable journey with 'Consistency Confections: A Muffin-Baking Exploration in Product Quality.' In this engaging activity, participants delve into the world of product consistency, a critical factor in commercial success. By immersing themselves in the art of muffin baking, participants work collaboratively in groups to select and implement methods ensuring uniform size and shape.Each group meticulously measures their muffins, and through thoughtful data analysis, participants eva
Subjects:
Grades:
Not Grade Specific
Types:
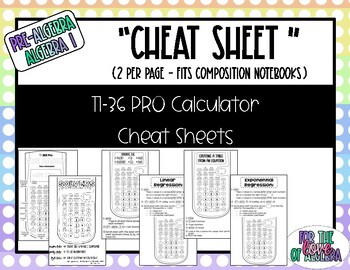
TI-36 PRO Scientific Calculator Cheat Sheets
These "cheat sheets" are half sheets of paper and fit into an interactive notebook. They are great visuals for kids when using the calculator for help with the following topics:The basic uses / functionsCreating a table from an equationSolving for xSolving systems of equationsSolving quadratic equationsLinear & Exponential Regressions (Line of Best Fit)Mean & MedianMax / MinQuartiles
Subjects:
Grades:
Not Grade Specific
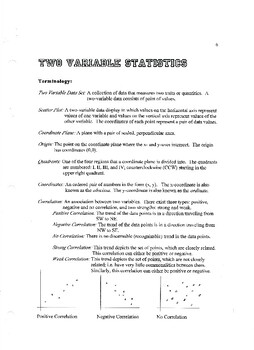
Statistics - Two Variable Stats
Introduction to two-variable statistics. Included: terminology, graphical correlation, and TI-84 steps and analysis.
Subjects:
Grades:
Not Grade Specific
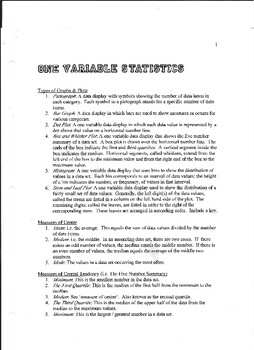
Statistics - One Variable Stats
Includes an introduction into the types of graphs, measures of center, measures of central tendency, and standard deviation. TI-84 calculator steps are included in addition to selected formulas.
Subjects:
Grades:
Not Grade Specific

Statistics Problems with Worked Solutions
Each book in our series of worked problems contains hundreds of problems with answers, and detailed solutions.The answers are separate from the solutions since many students just want to know that their answer is wrong before trying the problem again.Titles in the series: 1. Pre-Algebra Problems with Worked Solutions2. Algebra Problems with Worked Solutions3. Pre-Calculus Problems with Worked Solutions4. Calculus Problems with Worked Solutions5. Statistics Problems with Worked SolutionsPlease no
Subjects:
Grades:
Not Grade Specific
Types:
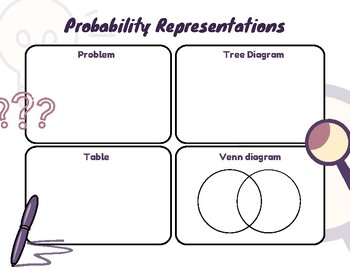
Visual Representations of Probability Graphic Organizer
Graphic Organizer for teaching visual representations of probability. Tree DiagramArea Model (table)Venn DiagramExample of completed sheet included.
Subjects:
Grades:
Not Grade Specific
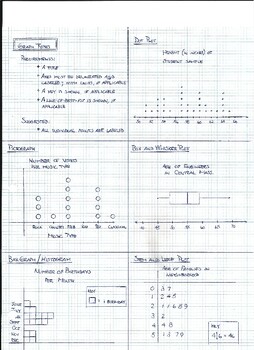
Statistical One-Variable Graphs
Different one-variable plots are illustrated, including their respective requirements.
Subjects:
Grades:
Not Grade Specific
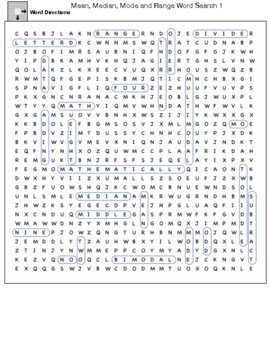
Mean, Median, Mode and Range Word Search
Mean, Median, Mode and Range Word SearchTo differentiate 3 versions are provideword listaddingbimodaldatadivideeightfourletter dmathmathematicallymeanmedianmiddlemomodemultimodalninenooddorderrangesubtractthirteentwotwo middleThe Data set 9,4,17,4,7,8,14 was used for finding the Mean, Median, Mode and RangeThis provided the numbers four, eight, nine and thirteen in the word search
Subjects:
Grades:
Not Grade Specific
Types:
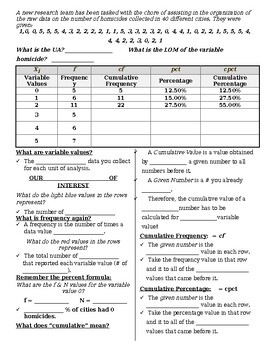
Univariate Stats: Frequency Distribution Table, Scaffolded Notes, Animated PPW
This Univariate Stats: Frequency Distribution Table resource contains scaffolded note pages that correspond to an interactive PowerPoint for your scientific method or statistics unit. There is a Tip & Tricks slide and corresponding note page that compiles feedback, notes, and helpful information I have personally seen benefit my students.Please be aware that this lesson was designed for a criminal justice-based statistics course; as such, topics and applied word problems use related themes.S
Subjects:
Grades:
Not Grade Specific
CCSS:
NGSS:
MS-LS4-6
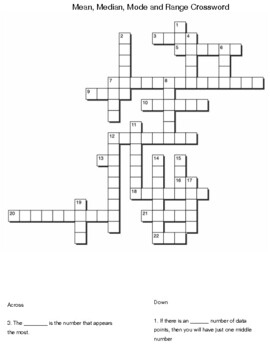
Mean, Median, Mode and Range Crossword
Mean, Median, Mode and Range CrosswordTo differentiate a version with a word list is providedword listaddingbimodaldatadivideeightfourletter dmathmathematicallymeanmedianmiddlemomodemultimodalninenooddorderrangesubtractthirteentwotwo middle
Subjects:
Grades:
Not Grade Specific
Types:
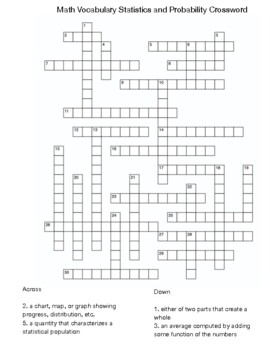
Math Vocabulary Statistics and Probability Crossword
Math Vocabulary Statistics and Probability CrosswordTo differentiate a version with a word list is providedWord List : (30 words)associationcausationcomplementcorrelationdatadistributionempiricalexponentialfrequencyinferenceintersectionintervalmeanmedianmodemodeloutcomeoutlierparameterpermutationplotpopulationprobabilityproportionrandomizationsimulationstatisticssurveytrendvariable
Subjects:
Grades:
Not Grade Specific
Types:
Standard Normal Table: Statistics Handout
The included handout is a one-page PDF handout with areas under a normal curve that can be looked up using z-scores between -3.49 and 3.49 up to two decimal places. Instead of photocopying from a textbook or scaling free images online to create your own handout, give this handout to your students who are trying to find areas under standard normal curves. Print copies for all of your students as needed or laminate a set to keep in your class.If you are looking for your students to get some practi
Subjects:
Grades:
Not Grade Specific
Types:
Also included in: The Normal Distribution: Statistics Worksheet + Standard Normal Table
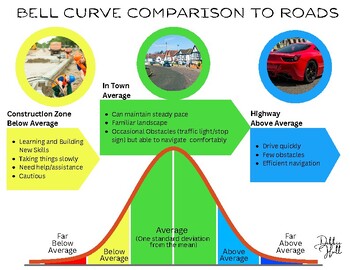
Bell Curve Comparison/Analogy to Roads
Embark on a journey of comprehension with this printable document, designed to demystify the complexities of standard curve data interpretation using a relatable road analogy. This image serves as a valuable resource for evaluation meetings, educational settings, or any scenario where understanding statistical distributions is paramount. You can use this image to explain standard scores to students, parents and staff. In the realm of driving, imagine your skill level as the journey on a road.
Grades:
Not Grade Specific
Types:
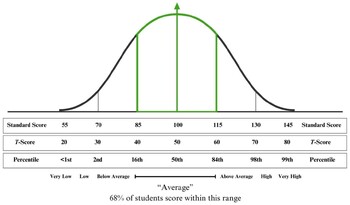
Bell Curve Diagram, Standard Scores, T-Scores, Percentiles
This bell curve diagram helps to illustrate standard scores, T-scores, percentiles, and qualitative descriptors. Print and bring to meetings to explain scores to team members, or include directly in your psychoeducational reports.
Subjects:
Grades:
Not Grade Specific
Types:
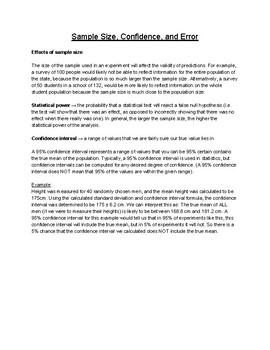
Sample Size, Confidence, and Error
Handout reviewing sample, size confidence, and error and how they affect results
Subjects:
Grades:
Not Grade Specific
Types:
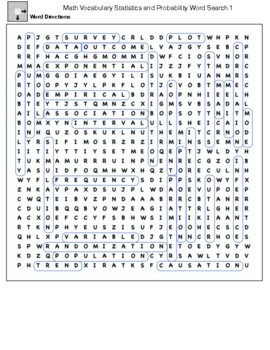
Math Vocabulary Statistics and Probability Word Search
Math Vocabulary Statistics and Probability Word SearchTo differentiate 3 versions are providedWord List : (30 words)associationcausationcomplementcorrelationdatadistributionempiricalexponentialfrequencyinferenceintersectionintervalmeanmedianmodemodeloutcomeoutlierparameterpermutationplotpopulationprobabilityproportionrandomizationsimulationstatisticssurveytrendvariable
Subjects:
Grades:
Not Grade Specific
Types:
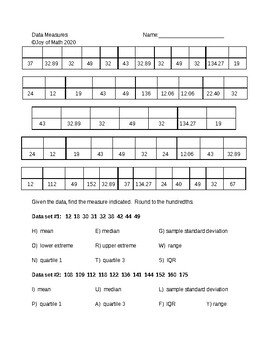
Data Measures
This is a short self-checking quote puzzle that is to be used as a quick practice. The data measures that are to be calculated include mean, median, sample standard deviation, range, quartile 1, quartile 3, and IQR. It can be completed with or without the use of a calculator. The second side which is not part of the quote puzzle requires students to use a frequency table to calculate the data measures listed previously.
Subjects:
Grades:
Not Grade Specific
Types:

Finding the Mean: Dice Activity
As teachers, our priorities are always our students. Preparing them for state tests are vital, and providing them with the proper material and questions to prepare are crucial.Presenting our students with engaging activities that have cultural relevance and are applicable to the real world are vital. Encouraging creativity and problem solving skills are crucial to the developing minds of our students.In this purchase, you will be provided withWorksheet for calculating the mean, based on a data s
Subjects:
Grades:
Not Grade Specific
Types:
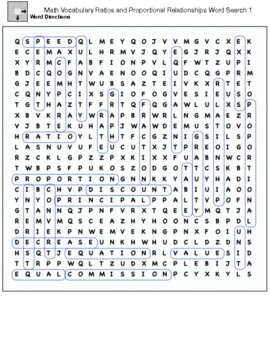
Math Vocabulary Statistics and Probability Word Search
Math Vocabulary Statistics and Probability Word SearchTo differentiate 3 versions are providedcommissioncompareconvertdecreasediscountequalequationequivalentexpressfractiongraphgratuityinterestpercentprincipalproportionproportionalquantityrateratiorelationshipspeedtableunitvalue
Subjects:
Grades:
Not Grade Specific
Types:
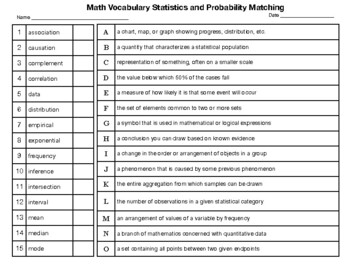
Math Vocabulary Statistics and Probability Word Search
Math Vocabulary Statistics and Probability Word SearchWord List : (30 words)associationcausationcomplementcorrelationdatadistributionempiricalexponentialfrequencyinferenceintersectionintervalmeanmedianmodemodeloutcomeoutlierparameterpermutationplotpopulationprobabilityproportionrandomizationsimulationstatisticssurveytrendvariable
Subjects:
Grades:
Not Grade Specific
Types:
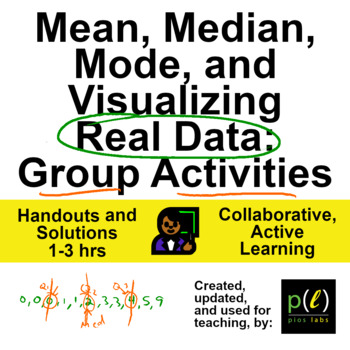
Mean, Median, Mode, and Visualizing Real Data - Group Activities
These activities and handouts task groups of students to calculate the mean, median, mode, and range of real data, as well as plotting a box plot and a histogram, through 6 group activities that can take 1 to 3 hours, depending on the class. Solutions are provided where applicable (3 activities).Target Level of Math Class:Pre-algebra, arithmetic, introduction to statistics, data visualizationAccess to calculators.For completion in groups in person, with students actively sharing solutions with
Subjects:
Grades:
Not Grade Specific
Types:
Showing 1-24 of 35 results


