5 results
Higher education statistics cultural activities
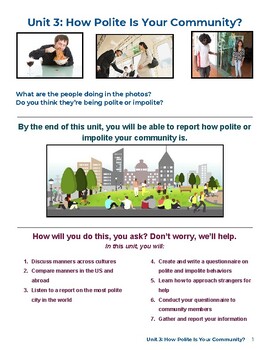
Project-based Unit on Polite/Impolite Behaviors
This project-based unit on polite behaviors is an engaging and interactive way for ESL students to build their communication skills. Other skills and systems are targeted in the unit, such as reading to make predictions and writing a hypothesis. Depending on the dynamics of the class and instructor, this unit can be completed in 1-2 weeks.Although students are expected to conduct surveys in public and present their findings, the tasks can be adapted to suit the class's comfort zones and needs. F
Grades:
9th - 12th, Higher Education, Adult Education
Types:
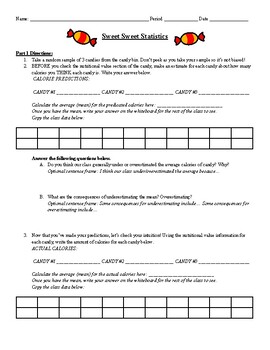
Halloween / Fall Statistics Class Activity for Box Plots and Five Number Summary
Hello!If you're looking for a fun and engaging activity for your Statistics Class this Halloween or fall season, this activity is great! My students enjoy getting the opportunity to eat candy as they work on some real-world statistical applications. The activity requires students to collect data, share data with their peers, and analyze the data. They will be working on creating a five number summary and analyzing/drawing box plots. You will need to purchase candy for this activity. Please reach
Subjects:
Grades:
9th - 12th, Higher Education
CCSS:
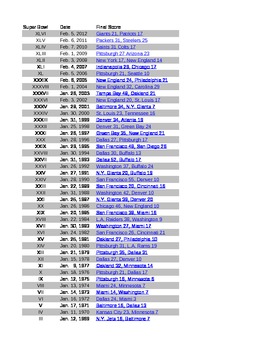
Is there a Correlation or Causation to football Scores
What does it really take to win a Super Bowl? During this activity you will explore the statistics behind winning and losing the game. make predictions and explain your data. correlation, causation, linear regression
Subjects:
Grades:
9th - 12th, Higher Education, Adult Education, Staff
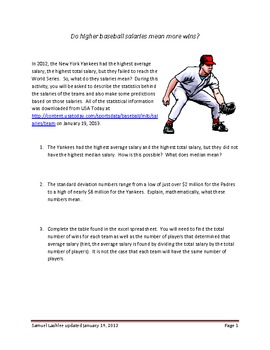
The Statistics of Baseball Salaries 2012
The statistics behind the salaries of the teams and also make some predictions based on those salaries. New York Yankees Philadelphia Phillies Boston Red Sox Los Angeles Angels Detroit Tigers Texas Rangers Miami Marlins San Francisco Giants St. Louis Cardinals Milwaukee Brewers White Los Angeles Dodgers Minnesota Twins Mets Chicago Cubs Atlanta Braves Cincinnati Reds Seattle Mariners Baltimore Orioles Washington Nationals Cleveland Indians Colorado Rockies Toronto Blue Jays Arizona Diamondbacks
Subjects:
Grades:
8th - 12th, Higher Education, Adult Education, Staff
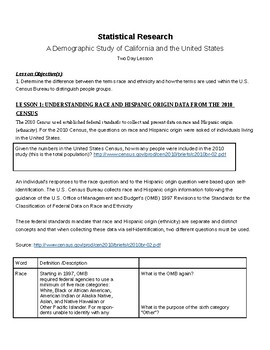
Statistical Analysis: U.S. Census Data Overview
This lesson uses data from the 2010 U.S. Census to allow students to access numbers and data in a social science classroom. The lesson is a 2 day mini-unit centered on working with charts, graphs, and tables (serves extremely well for SAT and ACT prep). This cross-curricular lesson draws meaningful parallels between math and social science, and the necessity of bringing these subjects together. The lesson uses a comparative look at Census data for California and the United States as a whole, but
Subjects:
Grades:
9th - 12th, Higher Education
Types:
Showing 1-5 of 5 results


