35 results
Higher education statistics task cards
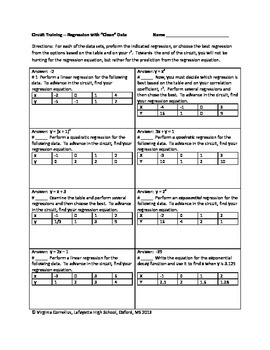
Circuit Training - Linear, Quadratic and Exponential Regression
Give your students engaging practice with the circuit format! Students will need to use technology (graphing calculator, on-line software) to calculate regression equations to advance in the circuit. At first students will be told what kind of regression, but towards the end of the circuit students need to try several regressions and compare the r-value to see which is the best fit. 16 equations total. Can be turned into task cards or even a scavenger hunt.In addition, many of the answers ar
Subjects:
Grades:
8th - 11th, Higher Education
Types:
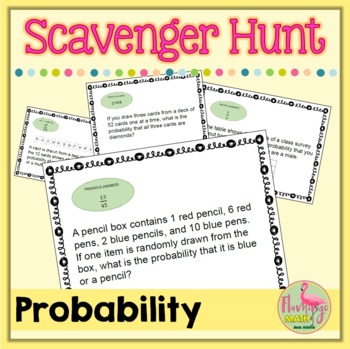
Probability Scavenger Hunt (Algebra 2 - Unit 12)
This Probability Scavenger Hunt Activity is designed to help your Algebra 2 students understand permutations, combinations, theoretical and experimental probability, independent and dependent events, two-way tables, conditional probability, and compound events at the end of the unit on Probability. There are 12 task cards in the activity.Students begin at a specified station, their answer leads them to the next task card. If done correctly, they will end where they began. A student recording sh
Subjects:
Grades:
8th - 11th, Higher Education
Types:
Also included in: Algebra 2 Curriculum Mega Bundle | Flamingo Math
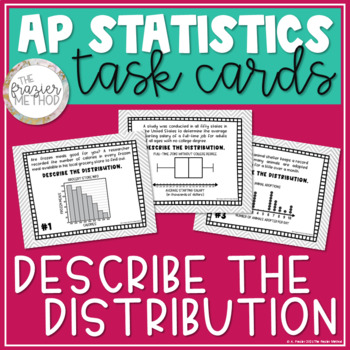
AP Statistics Task Cards Review Activity Describe the Distribution Data Displays
Use these DESCRIBE THE DISTRIBUTION TASK CARDS to help your students review for the AP Stats Exam! Students will describe the shape, center, spread, and unusual features of distributions displayed in a histogram, boxplot, stem-and-leaf plot, dot plot, and cumulative relative frequency plot. AP Statistics students will also determine which measure of center (median or mean) and measure of spread (range, standard deviation, or interquartile range) to use based on the shape of the distribution – sk
Subjects:
Grades:
10th - 12th, Higher Education
Types:
Observational Study vs. Survey vs. Experiment Sort
Students sort 15 scenarios into 3 categories: observational study, survey, and experiments. The then cut out scenario and glue it in the correct area. If you like this activity, please consider following my store and checking out other products. I would love to hear your feed-back in your review.
Subjects:
Grades:
11th - 12th, Higher Education
Types:
Also included in: GSE Algebra 2 Unit 7 Bundle
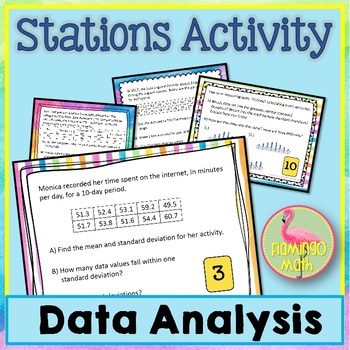
Data Analysis Station Activity (Algebra 2 - Unit 13)
This Data Analysis Station Activity is designed to help your Algebra 2 students understand measures of central tendency, data analysis, normal distributions, and more, at the end of the unit on Data Analysis and Statistics. There are 10 task cards in the activity. Students will review the following concepts/topics:★ measures of central tendency (mean, median, mode, range, standard deviation)★ make box-and-whisker plots and analyze data information★ find z-scores, standard deviation, and weigh
Subjects:
Grades:
8th - 11th, Higher Education
Types:
Also included in: Algebra 2 Curriculum Mega Bundle | Flamingo Math
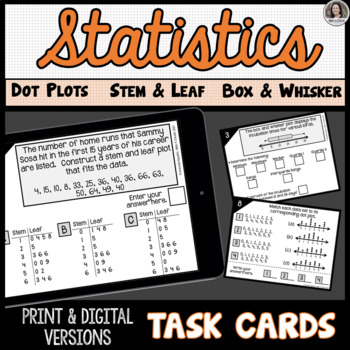
Statistics: Steam and Leaf Plots, Dot Plots, Box and Whisker Plots Task Cards
Students will practice constructing and interpreting stem and leaf plots, dot plots, and box and whisker plots by completing these 16 unique task cards. Students will demonstrate a deep understanding of the various plots by identifying key concepts: Mean, Median, Mode, Range, Interquartile Range, Minimum, Maximum, and/or Quartiles. This activity is an ideal assignment for students to complete at the conclusion of a Statistics unit for review and extra practice.Tasks Include:Construct a stem and
Subjects:
Grades:
6th - 12th, Higher Education
Types:
Prob & Stats Population vs Sample using DIGITAL SELF CHECKING BOOM CARDS™
Probability and Statistics students will enjoy practicing identifying and classifying Populations and Samples with these fun and interactive digital Boom task cards! Students will be asked to determine the Population and the Sample for eight problem situations. Boom Cards are NO PREP required and SELF-CHECKING. I use Boom Cards with all of my classes and my students LOVE them. Boom Cards can be used as a synchronous whole group activity OR can be assigned to students to complete asynchronously f
Subjects:
Grades:
11th - 12th, Higher Education
Types:
Prob & Stats Intro to Stats Bundle using DIGITAL SELF CHECKING BOOM CARDS™
Probability and Statistics students will enjoy practicing the basics of statistics with these fun and interactive digital Boom task cards! Boom Cards are NO PREP required and SELF-CHECKING. I use Boom Cards with all of my classes and my students LOVE them. Boom Cards can be used as a synchronous whole group activity OR can be assigned to students to complete asynchronously from individual devices. These digital task cards provide students with instant feedback! You will get a total of 8 Boom Car
Subjects:
Grades:
11th - 12th, Higher Education
Types:
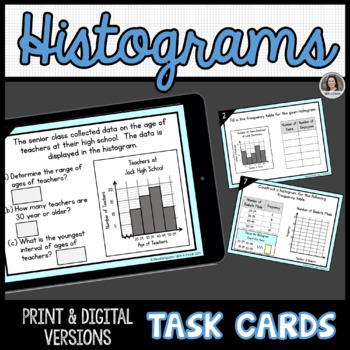
Histograms Task Cards, Print and Digital Google Slides™
Students will practice graphing, reading, and interpreting histograms by completing these 12 unique task cards. Tasks Include:Given a histogram or frequency table, interpret the informationCreate a frequency table for the given histogram.Construct a histogram for a given frequency table or set of data.Determine the class width for a given set of dataConstruct a frequency table for a given set of data.Included:A pdf with a link to make a copy of the Interactive Google Slides™ for your own Google
Subjects:
Grades:
6th - 12th, Higher Education
Types:
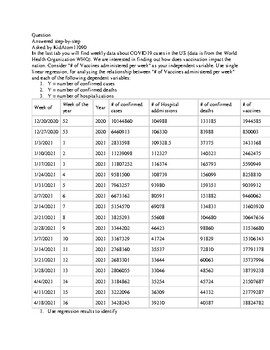
How does vaccination impact the nation-COVID19_Cases_in_the US_ MATH-Statistics
In the last tab you will find weekly data about COVID19 cases in the US (data is from the World Health Organization WHO). We are interested in finding out how does vaccination impact the nation. Consider "# of Vaccines administered per week" as your independent variable. Use single linear regression, for analyzing the relationship between "# of Vaccines administered per week" and each of the following dependent variables: Y = number of confirmed casesY = number of confirmed deathsY = number of h
Subjects:
Grades:
Higher Education, Adult Education, Staff
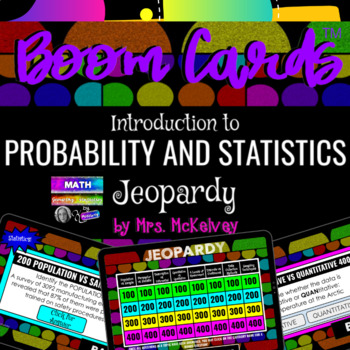
Intro to Statistics Jeopardy Review Game using DIGITAL SELF CHECKING BOOM CARDS™
Probability and Statistics students will enjoy reviewing population vs. sample, parameter vs. statistic, descriptive vs. inferential, quantitative vs. qualitative, the four levels of measurement, discrete vs. continuous, data collection methods, and sampling techniques with these fun and interactive digital Boom task cards! This deck is in the form of a Jeopardy style game, using Flow Magic to help students navigate from the game board, to feedback, and back to the game board for the next round!
Subjects:
Grades:
11th - 12th, Higher Education
Types:
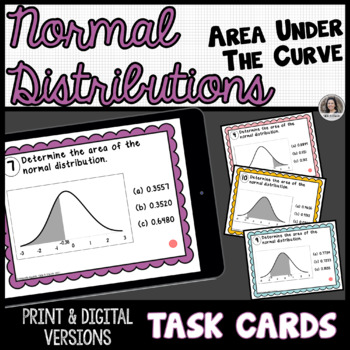
Normal Distributions Area of the Graph Print and Digital Slides Task Cards
Students will demonstrate their understanding and strengthen their math skills by completing these 12 unique task cards on finding probabilities of normal distributions given a graph. Students will practice finding the area to the left, to the right and between given z-scores under the normal curve. A recording worksheet is included for students to show work. Included:A pdf with a link to make a copy of the Interactive Google Slides™ for your own Google Drive™A printable version of the Task Card
Subjects:
Grades:
7th - 12th, Higher Education
Types:
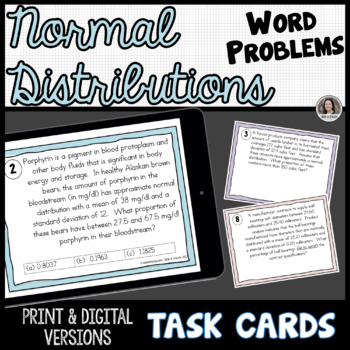
Normal Distributions Word Problems Print and Digital Google™ Slides Task Cards
Students will demonstrate their understanding and strengthen their math skills by completing these 12 unique task cards on normal distributions word problems. Students will practice finding the percent or proportions to the left, to the right and between given values. A recording worksheet is included for students to show work. Included:A pdf with a link to make a copy of the Interactive Google Slides™ for your own Google Drive™A printable version of the Task CardsA recording worksheet for stude
Subjects:
Grades:
7th - 12th, Higher Education
Types:
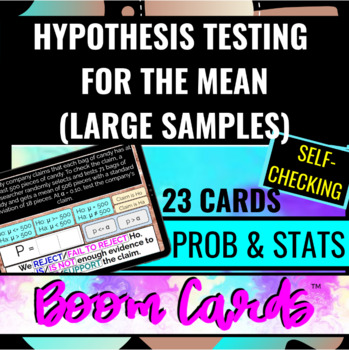
Prob & Stats Hypothesis Testing for the Mean (Large Samples) using BOOM CARDS™
Probability and Statistics students will practice Hypothesis Testing for the Mean (Large Samples) with these fun and interactive digital Boom task cards! Students will practice identifying the null hypothesis and alternative hypothesis in several problem situations, as well as stating which hypothesis represents the claim. Students will also have to calculate P-values (I use TI-84 calculators with my students and we round to 4 decimal places on P-values). Students will compare the P-values to a
Subjects:
Grades:
11th - 12th, Higher Education
Types:
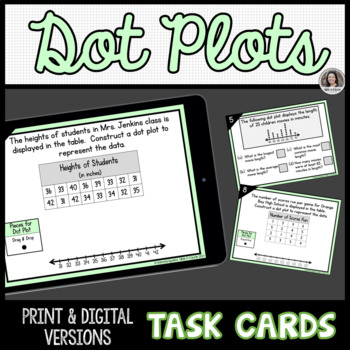
Dot Plots Task Cards, Print and Digital Google Slides™
Students will practice graphing, reading, and interpreting dot plots by completing these 12 unique task cards. Tasks Include:Create a dot plot given a set of dataDetermine mean, median, mode, range, 1st quartile, and 3rd quartile of a dot plotDescribe the shape of distribution of a dot plotIncluded:A pdf with a link to make a copy of the Interactive Google Slides™ for your own Google Drive™A printable version of the Task CardsA recording worksheet for students to show work.Answer keyDigital Vers
Subjects:
Grades:
6th - 12th, Higher Education
Types:
Prob & Stats Discrete vs. Continuous using DIGITAL SELF CHECKING BOOM CARDS™
Probability and Statistics students will enjoy practicing classifying and identifying Discrete vs. Continuous Data with these fun and interactive digital Boom task cards! Boom Cards are NO PREP required and SELF-CHECKING. I use Boom Cards with all of my classes and my students LOVE them. Boom Cards can be used as a synchronous whole group activity OR can be assigned to students to complete asynchronously from individual devices. These digital task cards provide students with instant feedback! Ch
Subjects:
Grades:
11th - 12th, Higher Education
Types:
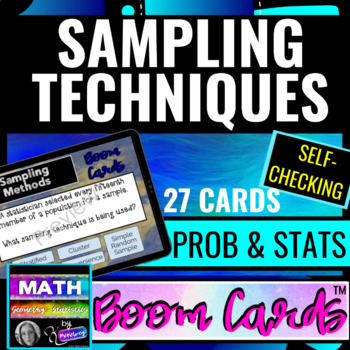
Prob & Stats Sampling Techniques using DIGITAL SELF CHECKING BOOM CARDS™
Probability and Statistics students will enjoy practicing classifying Sampling Techniques as Stratified, Cluster, Systematic, Simple Random Sample, or Convenience with these fun and interactive digital Boom task cards! Boom Cards are NO PREP required and SELF-CHECKING. I use Boom Cards with all of my classes and my students LOVE them. Boom Cards can be used as a synchronous whole group activity OR can be assigned to students to complete asynchronously from individual devices. These digital task
Subjects:
Grades:
11th - 12th, Higher Education
Types:
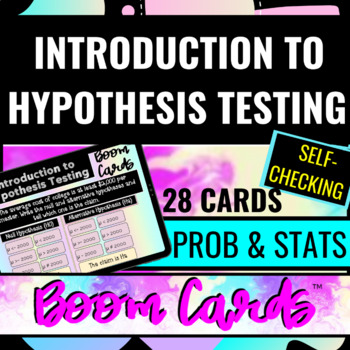
Prob & Stats Introduction to Hypothesis Testing using BOOM CARDS™
Probability and Statistics students will practice the basics of Hypothesis Testing with these fun and interactive digital Boom task cards! Students will practice identifying the null hypothesis and alternative hypothesis in several problem situations, as well as stating which hypothesis represents the claim. Students will also practice classifying problem situations as left-tailed, two-tailed, or right-tailed and identifying Type I/Type II errors. Boom Cards are NO PREP required and SELF-CHECKIN
Subjects:
Grades:
11th - 12th, Higher Education
Types:
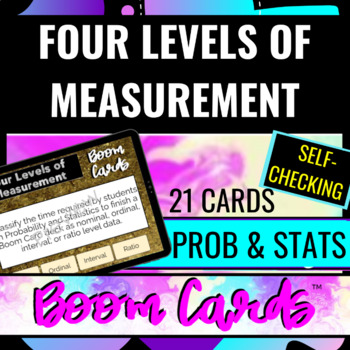
Prob & Stats Four Levels of Measurement using DIGITAL SELF CHECKING BOOM CARDS™
Probability and Statistics students will enjoy practicing the Four Levels of Measurement (Nominal, Ordinal, Interval, and Ratio) with these fun and interactive digital Boom task cards! Boom Cards are NO PREP required and SELF-CHECKING. I use Boom Cards with all of my classes and my students LOVE them. Boom Cards can be used as a synchronous whole group activity OR can be assigned to students to complete asynchronously from individual devices. These digital task cards provide students with instan
Subjects:
Grades:
11th - 12th, Higher Education
Types:
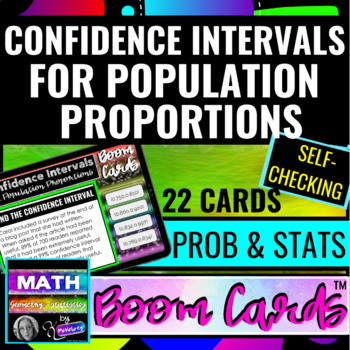
Prob & Stats Confidence Intervals for Population Proportions using BOOM CARDS™
Probability and Statistics students will practice constructing Confidence Intervals for Population Proportions with these fun and interactive digital Boom task cards! Students will first practice finding point estimates for p and z-critical values for some common confidence levels (90%, 95%, 98%, and 99%). Then students will use these skills to construct complete confidence intervals for Population Proportions when given A) the number of successes out of a total sample or B) the percentage of s
Subjects:
Grades:
11th - 12th, Higher Education
Types:
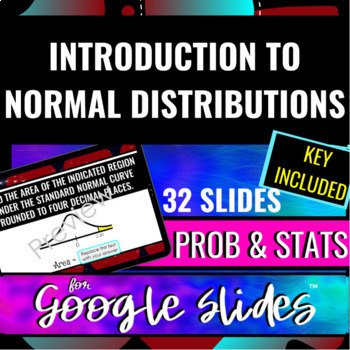
Prob & Stats Introduction to Normal Distributions using Google Slides™
Probability and Statistics students will enjoy finding areas of indicated regions under the Standard Normal Curve with these fun and interactive digital Google Slides™ task cards! Google Slides can be used as a synchronous whole group activity in the classroom, while sharing your screen virtually, OR can be assigned to students to complete asynchronously from individual devices. Check out the preview to see a PDF preview of the Google Slides™ file (with key) that you will get access to upon purc
Subjects:
Grades:
11th - 12th, Higher Education
Types:

Prob & Stats Confidence Intervals for Mean (Large Samples) using Google Slides™
Probability and Statistics students will enjoy constructing Confidence Intervals for the Mean (Large Samples) with these fun and interactive digital Google Slides™ task cards! Google Slides can be used as a synchronous whole group activity in the classroom, while sharing your screen virtually, OR can be assigned to students to complete asynchronously from individual devices. Check out the preview to see a peek of the PDF file (with key) that you will get access to upon purchasing this product (T
Subjects:
Grades:
11th - 12th, Higher Education
Types:
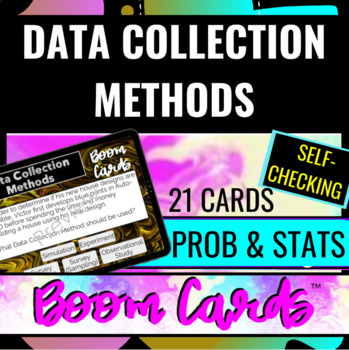
Prob & Stats Data Collection Methods using DIGITAL SELF CHECKING BOOM CARDS™
Probability and Statistics students will enjoy classifying Data Collection Methods into Surveys, Experiments, Observational Studies, or Simulations with these fun and interactive digital Boom task cards! Boom Cards are NO PREP required and SELF-CHECKING. I use Boom Cards with all of my classes and my students LOVE them. Boom Cards can be used as a synchronous whole group activity OR can be assigned to students to complete asynchronously from individual devices. These digital task cards provide s
Subjects:
Grades:
11th - 12th, Higher Education
Types:
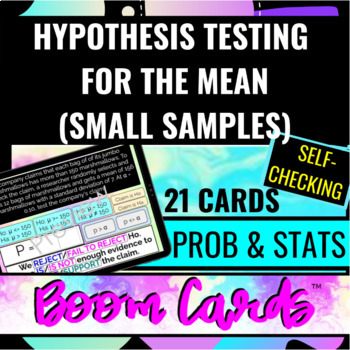
Prob & Stats Hypothesis Testing for the Mean (Small Samples) using BOOM CARDS™
Probability and Statistics students will practice Hypothesis Testing for the Mean (Small Samples) with these fun and interactive digital Boom task cards! First, students will review how to calculate t-critical values (using both the level of confidence (c) and the level of significance (αlpha)), the steps for hypothesis testing, and how to interpret the results of a Hypothesis Test using P-values. Then, students will practice identifying the null hypothesis and alternative hypothesis in several
Subjects:
Grades:
11th - 12th, Higher Education
Types:
Showing 1-24 of 35 results


