134 results
Higher education statistics independent work packets
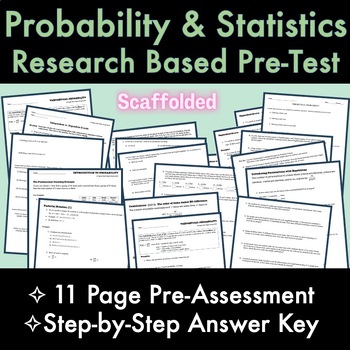
Statistics & Probability RESEARCH BASED 11-Page PreTest/PreAssessment with Key
87 qualified high school math teachers have been surveyed POST-COVID across the 6 subjects (algebra 1, algebra 2, geometry, precalculus, calculus, and statistics & probability). This 11-page research-based scaffolded statistics & probability pretest/ pre-assessment/ common assessment is a compilation of their answers to the question: what do you WISH students knew BEFORE taking the course? The assessment is scaffolded for students as well!---------------------------Check out my other res
Subjects:
Grades:
11th - 12th, Higher Education
CCSS:
Also included in: ALL HIGH SCHOOL MATH SUBJECTS Full PreTests with Keys - RESEARCH BASED
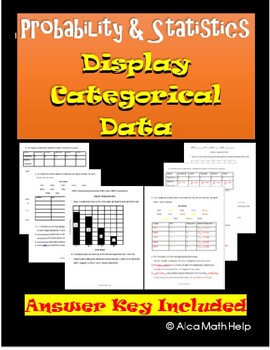
Categorical Data Display Pie Chart & Bar Chart: Worksheet, CW, HW CP & AP Stats
If you are looking for an easy to follow for students. You are at the right place. This is a quick and easy to follow activity sheet that brings across the concept clear and precise. Teachers in my department love this activity sheet. This is useful of CP Probability and Statistics, AP Statistics and Algebra 1 statistics unit. Categorical data and Display Variables ObjectivesAt the end of the lesson students should be able to:1. Correctly define categorical and quantitative data with examples2.
Subjects:
Grades:
8th - 12th, Higher Education, Adult Education, Staff
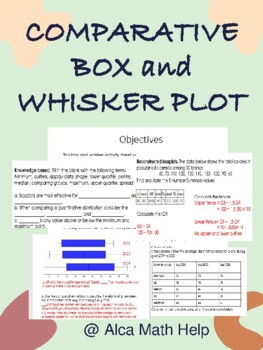
Comparison Box and Whisker Plots Worksheet, Quiz, Test for Stats & AP Stats
This box and whisker activity sheet was designed to test students understanding of the 5 number summary data values given quantitative data sets. Perfect for students in grade 10-12 doing statistics and you want to give them a challenge and should be manageable for students doing AP STATSAt the end of this activity students should be able to1. Students should be able to explain and construct box plots showing the different regions and what they represent. 2. Students should also be able to use
Subjects:
Grades:
11th - 12th, Higher Education, Adult Education, Staff
CCSS:

MEANS AND VARIANCES OF A RANDOM VARIABLE
Means and Variances of a Random VariableIn this lesson, students will learn:▪ how to apply the rules for sums or differences of means of two separate distributions or repeated trials from a single distribution▪ how to apply the rules for sums or differences of variances of two separate distributions or repeated trials from a single distribution
Subjects:
Grades:
10th - 12th, Higher Education
KEY | How Does Stratifying Improve on a Simple Random Sample?
How Does Stratifying Improve on a Simple Random Sample? In this lesson, students will learn:what is meant by an unbiased estimator or statistichow to simulate a simple random samplehow to simulate a sample proportionhow to simulate a stratified random sample.the difference between bias and variation.
Subjects:
Grades:
10th - 12th, Higher Education

KEY | MEANS AND VARIANCES OF A RANDOM SAMPLE
Means and Variances of a Random VariableIn this lesson, students will learn:▪ how to apply the rules for sums or differences of means of two separate distributions or repeated trials from a single distribution▪ how to apply the rules for sums or differences of variances of two separate distributions or repeated trials from a single distribution
Subjects:
Grades:
10th - 12th, Higher Education
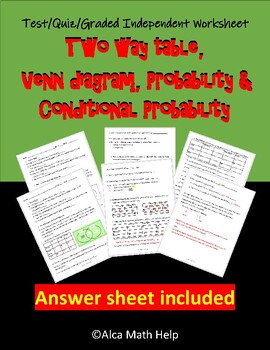
Unit Test/Quiz/Packet- Two-way table, Venn diagram, Conditional Probability
If you are looking for an easy to follow for students. You are at the right place. This is a quick and easy to follow activity sheet that brings across the concept clearly and precisely. Teachers in my department love this activity sheet. This is useful for CP Probability and Statistics, AP Statistics and Algebra 1 statistics unit.5W’s and How of statisticsAt the end of the lesson students should be able to:1. Recall the history of statistics2. Define the 5W’s and How of statistics with example
Subjects:
Grades:
9th - 12th, Higher Education, Adult Education, Staff
CCSS:

Do Heavier Cars Use More Gasoline?
In this lesson, students will learn:to create a scatterplot and a linear regression line on a graphing calculator.to assess how linear the data points are and how useful a linear regression will be.to create and interpret a residual plot.to make predictions using the regression line, distinguishing between extrapolations and interpolation
Subjects:
Grades:
10th - 12th, Higher Education

ARE ALTITUDE AND PRECIPITATION INDEPENDENT?
In this lesson, students will learn:to create and interpret a two-way tableto calculate "or" probabilities, "and" probabilities, or conditional probabilities— the "given" type, by reading a two-way table, or by applying one of the basic probability formulas.to viscerally decide if two events are independent--viscerally because they have not yet learned the Chi-square test of independence.
Subjects:
Grades:
10th - 12th, Higher Education

How Much TV Do College Students Watch?
In this lesson, students will learn:how to perform all the steps of a confidence intervalhow to perform all the steps of a significance testhow to predict the outcome of a two-tailed significance test by using the corresponding confidence interval
Subjects:
Grades:
10th - 12th, Higher Education
How Does Stratifying Improve on a Simple Random Sample?
How Does Stratifying Improve on a Simple Random Sample?In this lesson, students will learn:what is meant by an unbiased estimator or statistichow to simulate a simple random samplehow to simulate a sample proportionhow to simulate a stratified random sample.the difference between bias and variation.
Subjects:
Grades:
10th - 12th, Higher Education

KEY | Do Heavier Cars Use More Gasoline?
In this lesson, students will learn:to create a scatterplot and a linear regression line on a graphing calculator.to assess how linear the data points are and how useful a linear regression will be.to create and interpret a residual plot.to make predictions using the regression line, distinguishing between extrapolations and interpolation
Subjects:
Grades:
10th - 12th, Higher Education

KEY | ARE ALTITUDE AND PRECIPITATION INDEPENDENT?
In this lesson, students will learn:to create and interpret a two-way tableto calculate "or" probabilities, "and" probabilities, or conditional probabilities— the "given" type, by reading a two-way table, or by applying one of the basic probability formulas.to viscerally decide if two events are independent--viscerally because they have not yet learned the Chi-square test of independence.
Subjects:
Grades:
10th - 12th, Higher Education

KEY | How Much T.V. Do College Students Watch?
In this lesson, students will learn:how to perform all the steps of a confidence intervalhow to perform all the steps of a significance testhow to predict the outcome of a two-tailed significance test by using the corresponding confidence interval
Subjects:
Grades:
10th - 12th, Higher Education

Statistics & Probability
Two documents include questions and related vocabulary terms. The other two documents are the related answer keys.
Subjects:
Grades:
10th - 12th, Higher Education
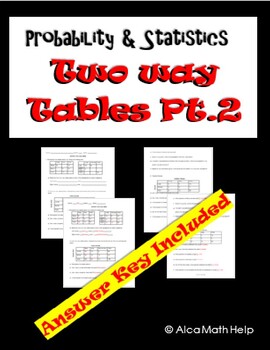
Probability & Statistics- Two-Way Table Worksheet, Homework, Quiz, AP Review
If you are looking for an easy to follow for students. You are at the right place. This is a quick and easy to follow activity sheet that brings across the concept clearly and precisely. Teachers in my department love this activity sheet and the students enjoy it. This is useful for CP Probability and Statistics, AP Statistics and Algebra 1 Statistics unitAt the end of the lesson students should be able to:1. Define two-way tables with its properties.2. Create two- way tables using frequency co
Subjects:
Grades:
9th - 12th, Higher Education, Adult Education, Staff
CCSS:

Cell Cycle/Mitosis Scenario with Chi-Square Analysis
What's better than a cell cycle and mitosis review? A cell cycle and mitosis review that also has students complete a chi-squared analysis of data!Students will run through a lab-based scenario to help review the steps of the cell cycle and mitosis. They will also been given data based on this scenario and complete a full chi-squared analysis, including null and alternate hypotheses, using the chi-square critical values table, completing the calculations for chi-squared, and reaching a conclu
Subjects:
Grades:
10th - 12th, Higher Education, Adult Education
Also included in: Cell Cycle/Mitosis and Chi-Squared Analysis Activity and Answer Key
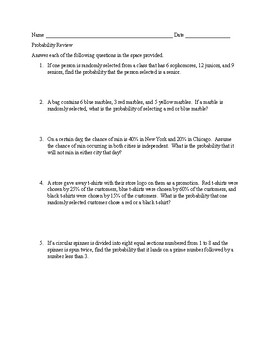
Probability Review with Answer Key
This 22-question packet contains questions for mutually exclusive/inclusive events, complementary events, independent events, permutations and combinations, and conditional probability. The questions are mixed up so students have to determine whether they need to multiply, use the addition rule, use the conditional probability formula, or use their calculator to figure out a permutation or combination.I use this assignment as a review in my lower level Prob & Stats class.
Subjects:
Grades:
10th - 12th, Higher Education
CCSS:
Also included in: Probability Bundle - PowerPoint, HW, Quizzes with Answer Keys
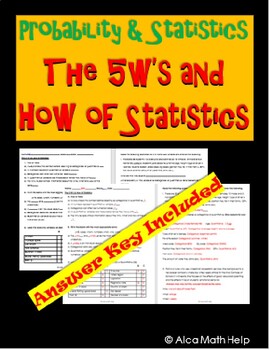
The 5W's & How of Statistics Worksheet, CP Stats, AP Stats, HW, Back-to-School
If you are looking for an easy to follow for students. You are at the right place. This is a quick and easy to follow activity sheet that brings across the concept clearly and precisely. Teachers in my department love this activity sheet. This is useful for CP Probability and Statistics, AP Statistics and Algebra 1 statistics unit.5W’s and How ObjectivesAt the end of the lesson students should be able to:1. Recall the history of statistics2. Define the 5W’s and How of statistics with examples3.
Subjects:
Grades:
8th - 12th, Higher Education, Adult Education, Staff
CCSS:
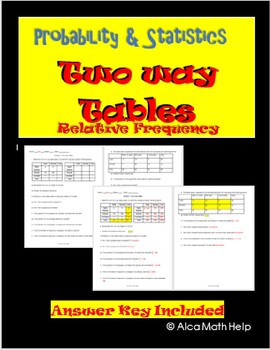
Two-Way Tables Worksheet, Homework, CW, Review, Quiz for CP Stats, AP Stats
If you are looking for an easy to follow for students. You are at the right place. This is a quick and easy to follow activity sheet that brings across the concept clear and precise. Teachers in my department love this activity sheet. This is useful of CP Probability and Statistics, AP Statistics and Algebra 1 statistics unit. Frequency Tables ObjectivesAt the end of the lesson students should be able to:1. Define two-way tables with its properties.2. Create two-way tables using frequency count
Subjects:
Grades:
10th - 12th, Higher Education, Adult Education, Staff
CCSS:
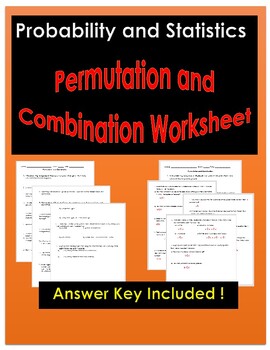
Permutation and Combination Worksheet/Activity/Packet | Alca Math Help
If you are looking for an easy to follow for students. You are at the right place. This is a quick and easy to follow activity sheet that brings across the concept clearly and precisely. Teachers in my department love this activity sheet. This is useful for CP Probability and Statistics, AP Statistics and Algebra 1 statistics unit.Objectives1. Recognize the difference between permutation and combination.2. Use the fundamental counting principle: or/and.3. Correctly use both formula either by ha
Subjects:
Grades:
9th - 12th, Higher Education, Adult Education, Staff
CCSS:
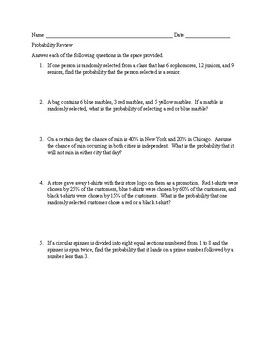
Probability Review
This 22-question packet contains questions for mutually exclusive/inclusive events, complementary events, independent events, permutations and combinations, and conditional probability. The questions are mixed up so students have to determine whether they need to multiply, use the addition rule, use the conditional probability formula, or use their calculator to figure out a permutation or combination.I use this assignment as a review in my lower level Prob & Stats class.If you would like t
Subjects:
Grades:
10th - 12th, Higher Education
CCSS:
Also included in: Probability Bundle - PowerPoint, HW, Quizzes

Baseball Salaries! | Answer Key
Answer Key for Baseball Salaries!
Subjects:
Grades:
10th - 12th, Higher Education

Creating Surveys and Analyzing Data, In-Class Activity
This activity walks students through the process of creating a survey, collecting results, and analyzing data. It is an assignment that can be done independently by students in class. Students that have any difficulty should be able to easily get assistance from fellow students. Rather than simply learning the terminology that comes with surveys and collecting research data, the student will use critical thinking to create and analyze their own surveys.
Subjects:
Grades:
10th - 12th, Higher Education
Showing 1-24 of 134 results


