75 results
3rd grade statistics handouts
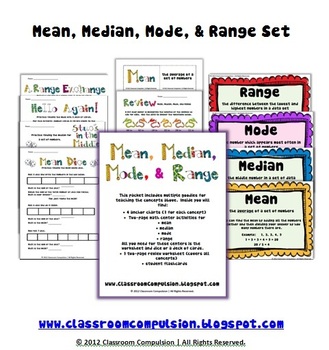
Mean Median Mode Range Pack (Math Centers, Flashcards, Anchor Charts)
This pack has everything you need to supplement your Mean, Median, Mode, and Range instruction! It includes 4 colorful anchor charts (1 for each concept)for you to display around the room, 4 two-page math centers that only require dice or a deck of cards (1 for each concept), a fun set of flashcards for your students, and a two-page review worksheet that covers all the concepts. The preview photos do not show all the pages.
Subjects:
Grades:
3rd - 6th
CCSS:
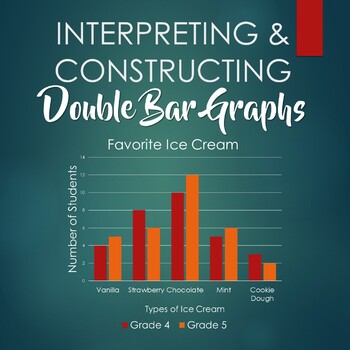
Interpreting and Constructing Double Bar Graphs - Booklet
This booklet includes six worksheets:- 3 double bar graphs for students to interpret- 3 sets of data for students to construct double bar graphs, with corresponding questions- answer key
Subjects:
Grades:
3rd - 6th
Types:
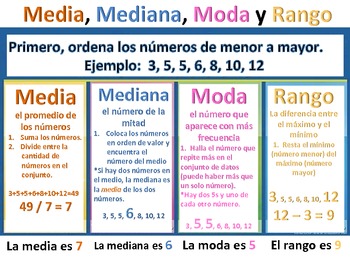
Media, Mediana, Moda, Rango (Mean, Median, Mode, Range) - Spanish
Media, Mediana, Moda, Rango (Mean, Median, Mode, Range) - Spanish. Español. Math. Matemáticas. Dual-Language. Bilingual. Bilingüe.
Subjects:
Grades:
3rd - 5th
Finding Mean, Median, Mode, and Range
Simple worksheets (5 problems each) to introduce and practice finding the mean, median, mode, and range of a data set. Have students complete with or without calculator, depending on their instructional level. Product includes:-Reference posters for mean, median, mode, and range. Each poster includes the measures' definitions and directions for how to find them with an example.-5 worksheets about finding the mean.-5 worksheets about finding the median.-5 worksheets about finding the mode.-5 work
Subjects:
Grades:
1st - 12th
Types:
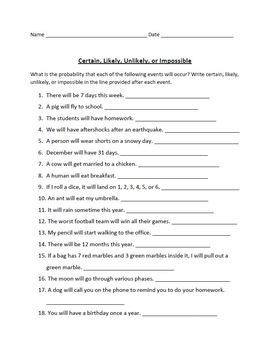
Probability: Certainly, Likely, Unlikely, or Impossible Worksheet
Students will be asked to write if the events given will certainly occur, are likely to occur, are unlikely to occur, or impossible. An answer key is included.
Subjects:
Grades:
2nd - 5th
Types:
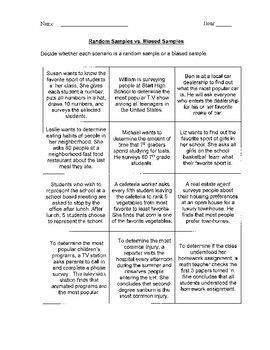
Random or Biased Sample? (Activity/Practice)
This resource can be used as a class activity or individual practice worksheet. Students are given 12 situations to analyze, and they must decide whether each of them represents a random sample or a biased sample. If being used as a class activity, students should cut out the squares (each situation is on one square). They can then tape them onto the board (have the board divided into 2 categories) based on what kind of sample they believe it is. As a class, you can then discuss each situati
Subjects:
Grades:
3rd - 12th
Types:
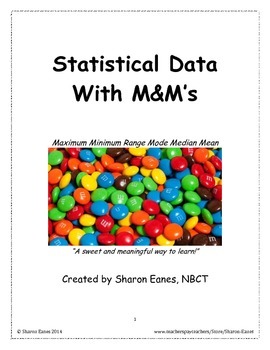
Statistical Data with M&M's
What better way to practice statistical concepts than with edible, chocolate, manipulatives? This hands on activity provides students the opportunity to sort and record data, then use information to determine maximum, minimum, range, mode, median, and mean. In addition, students create a bar graph, charting their data and finish the activity with a written language component. I like to introduce statistics during review of place value and number systems, toward the beginning of the school yea
Subjects:
Grades:
3rd - 6th
Types:
CCSS:

Probability and Sample Space Notepage and Practice
Probability and Sample Space Notepage and Practice
This 2 page hand out defines probability and sample spaces in easy to understand terms. Great as reference pages students can add to a math notebook.
Quick application problems are included.
***************************************************************************
Check Out My Other Math Resources
Ratio Notes featuring Pop Singers
Percent, Decimal, and Fraction Review Packet
Box and Whisker Plots--Note Sheet and Practice
*************
Subjects:
Grades:
3rd - 8th
Types:
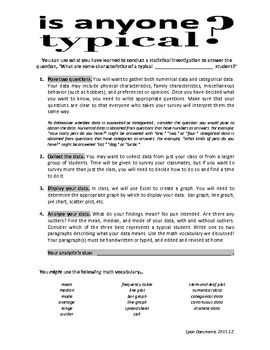
Statistics Analysis Project - Is Anyone Typical?
A great way for students to apply and use basic statistics: mean, median, mode, range, outlier, categorical and numerical data, and graph types. Incorporates Excel. Fun, engaging, and easy to teach. Also, a great way for "tweens" to learn that no one is "typical." Appropriate for third through eighth grade. I use it with my fifth and sixth graders and it is always a huge hit! The results also look great on our bulletin board!
Subjects:
Grades:
3rd - 8th
Probability Practice Galore!
A great resource for teaching Probability! These two mini-booklets contain large images to use for word study or as anchor charts, two worksheets involving spinners and probability lines, and extra probability worksheets. It's likely that these will come in handy!
Subjects:
Grades:
3rd - 6th
Types:
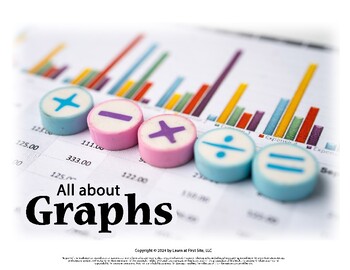
All About Graphs Activity Packet (9 pages worksheet + 4 pages answer key)
Students will have the opportunity to learn and explore tables, graphs, and charts as well as practice making all three in this engaging packet.An educational, informative, and hands-on supplement to a math curriculum, particularly in the area of statistical representation.The activities included can be rearranged to fit your curriculum.This packet includes the following pages:Title Sheet - All About GraphsGraphs, Charts, and Tables… - An infographic style presentation of how the three are simil
Subjects:
Grades:
1st - 4th
Types:
5th Grade VA SOL 5.14 PROBABILITY PT. 2
VA MATH SOL 5.14 PROBABILITY PT. 2 Review is designed to review and practice key concepts introduced in the MATH SOL objective. This can be used as morning work, homework, in centers, or at the end of your chapter review as an assessment. An answer key is provided!!
VIRGINIA SOL MATH TEST PREP
This product is designed to review and practice key concepts associated with the Virginia Standards of Learning (VA SOLs) in MATH. This can be used as morning work, homework, in centers, or at the end of
Subjects:
Grades:
3rd - 8th
Types:
CCSS:
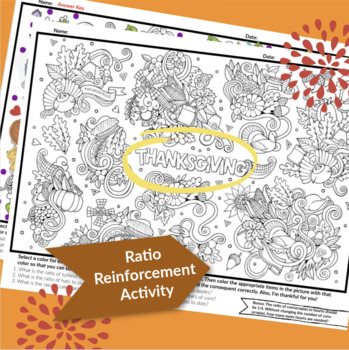
Ratios of Thanksgiving Activity
Students will color specific items to reveal the ratios within this complicated image. Reinforces understanding of mathematical ratios, antecedent, and consequent placement as well as simplification of ratios/fractions. Answer key included.
Subjects:
Grades:
3rd - 12th
Centimeter & 1 Inch Grid Papers (Full Sheets Each)
A full sheet of Centimeter Grid Paper and a full sheet of 1 inch Grid Paper all contained in one easy to transport/store .pdf. You can use these sheets with making charts, plotting points, etc... Enjoy and thank you for your support.
Subjects:
Grades:
PreK - 12th, Higher Education, Adult Education, Staff
Types:
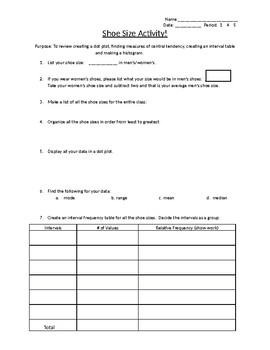
Shoe size group activity! Review dot plots and histograms.
This activity was created as a review for creating a dot plot, finding measures of central tendency, creating an interval table and making a histogram. All these items are covered in this group activity for your class! Kids enjoy working together while reviewing and learning all at one time.This is a word document that you change change anyway to fit your classes needs.
Subjects:
Grades:
3rd - 12th
Types:
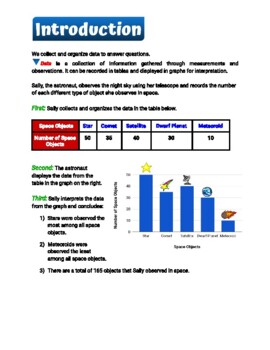
Introduction to Data: Mean, Median, Mode and Range
A complete 5-day unit on Introduction to Data: Mean, Mode, Median and Range for Grade 3, Grade 4 or Grade 5This set includes:-5 days of practice worksheets and answer keys-Easy-to-follow explanation with examples for teachers and students-Fun word problems to motivate students to work on their own
Subjects:
Grades:
3rd - 5th
Types:
Frequency Table and Line Plot Practice
Frequency Table and Line Plot Practice
- Use the data that consists of student pets to create a frequency table and line plot.
- Template provided for frequency table and line plot. Student must construct using data.
- Great for assessment after introduction or review.
- Would make a great pre/post assessment piece.
--EARN TPT FEEDBACK CREDIT--
Please provide feedback after your download! Earn TpT Credits for purchases on TpT. You get one TpT Credit for every $ you spend on TpT. Thing is, you
Subjects:
Grades:
2nd - 7th
Types:
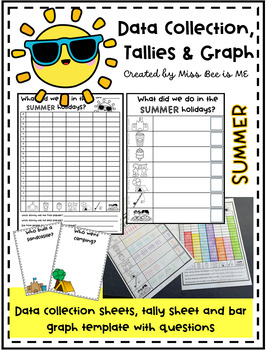
Summer/Back to School- Data Collection and Graphing
Back to school/Summer Statistics Activity...Collect the data, collate the data & display the data!
Subjects:
Grades:
1st - 3rd
Types:
5th Grade VA SOL 5.14 PROBABILITY PT. 3
VA MATH SOL 5.14 PROBABILITY PT. 3 Review is designed to review and practice key concepts introduced in the MATH SOL objective. This can be used as morning work, homework, in centers, or at the end of your chapter review as an assessment. An answer key is provided!!
VIRGINIA SOL MATH TEST PREP
This product is designed to review and practice key concepts associated with the Virginia Standards of Learning (VA SOLs) in MATH. This can be used as morning work, homework, in centers, or at the end of
Subjects:
Grades:
3rd - 8th
Types:
CCSS:
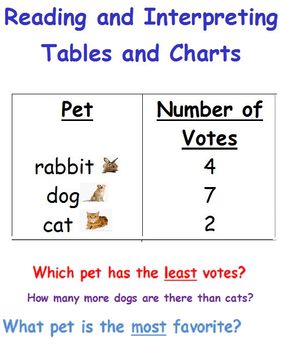
Reading a Table-Data and Statistics-First Grade
There are 4 different worksheets in which students can interpret the data of various tables. I hope they are of help to you! :)
Subjects:
Grades:
K - 3rd
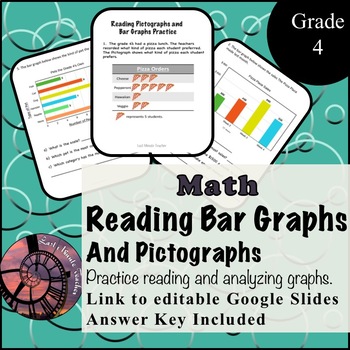
Reading Bar Graphs and Pictographs
Students struggling to read and analyze graphs?Here are over 10 pages of practice with bar graphs and pictographs.There are horizontal and vertical bar graphs for students to practice with, as well as many colourful pictographs.Designed to be used with the Grade 4 Math Makes Sense textbook, but also great practice for higher and lower levels.Studying from home?Not a problem!The zipped file includes an editable version using Powerpoint to share with students as well as a link to the Google Slides
Subjects:
Grades:
2nd - 6th
Types:
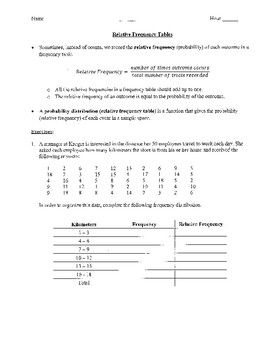
Relative Frequency Tables (Notes and Practice)
This resource can be used to introduce relative frequency tables (probability distributions). It begins with definitions and a formula for relative frequency (probability). It then provides 2 examples where students create relative frequency tables (probability distributions) based on sets of data. Students also create a bar chart to represent the data in the second example. A key is provided.
Subjects:
Grades:
3rd - 12th
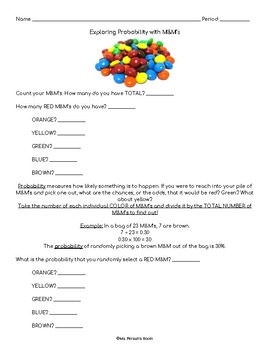
Probability with M&M's
Use this experiment as an introductory lesson to probability and statistics or a quick review of basic concepts for older grades. This product includes a space for students to record data, a question page where they can record their findings and explain their understanding, and space to create a graph of their findings.
Subjects:
Grades:
3rd - 7th
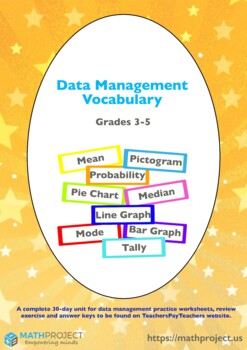
Data Analysis and Probability Vocabulary (Grade 3 to 6)
Data Analysis & Probability for Grade 3 to 6 / Introduction to Statistics : Definitions of Mean, Mode, Median, Pie Chart, Line Graph, Bar Graph, Tally Chart, Pictogram, Stem and Leaf Plot and Probability
Subjects:
Grades:
3rd - 8th
Showing 1-24 of 75 results


