564 results
Higher education statistics lessons
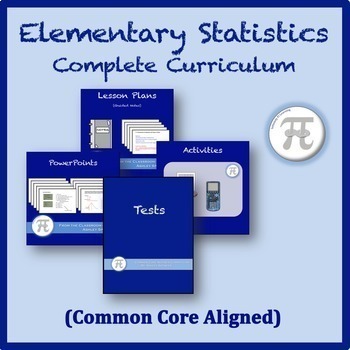
Elementary Statistics Complete Curriculum
VIEW FULL PREVIEW VIDEO HERE: https://youtu.be/eRPmKXVrmw4*Video Note: This video was made before changing to the bundle format, so the setup is a little different. Each section is an individual zipped file instead of being organized into folders. Quizzes and other extras can be found in the Bonus Content folder.Elementary Statistics Complete Curriculum (One Semester)This bundle includes everything in my Elementary Statistics Curriculum.The Complete Curriculum Includes:-Lessons with Lecture Note
Subjects:
Grades:
10th - 12th, Higher Education
Types:
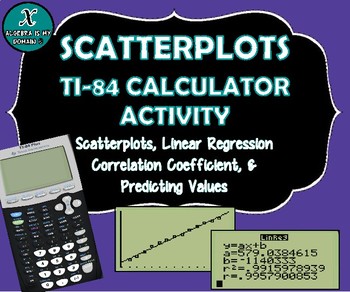
TI-84 CALCULATOR ACTIVITY - Data, Scatterplots, Regression & Line of Best Fit
This file includes four linear regression examples (all real-life data). The examples cover the following topics for the TI-84 graphing calculator:
* Creating a scatterplot
* Performing linear regression (finding the equation of the best-fit line)
* Interpreting the slope of the equation
* Calculating and interpreting the correlation coefficient
* Predicting values (using the linear regression equation)
The first example gives the step-by-step instructions to calculate all the necessary value
Subjects:
Grades:
7th - 12th, Higher Education
Types:
CCSS:
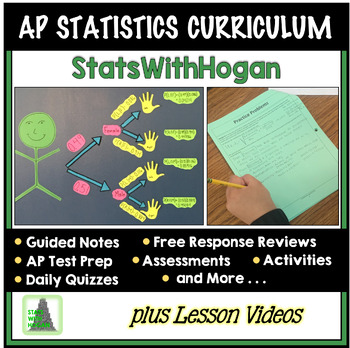
AP Statistics Curriculum Mega Bundle (with videos of each lesson)
This Bundle contains everything you will need to prepare your students for success on the AP® exam.I have designed these lessons over the past 12 years teaching AP Statistics. The organization and rigor of the lessons and practice have produced an AP pass rate well over the national average.I am redesigning the notes to make improvements including power point slides and keynote to present lessons. The upgrades will be free to those who have purchased this bundle. The curriculum was redesigned i
Subjects:
Grades:
9th - 12th, Higher Education
Types:
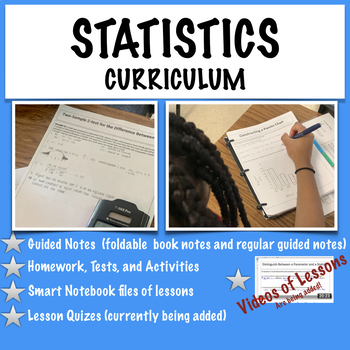
Statistics-Whole Curriculum (with videos of lessons)
This bundle will contain a whole curriculum for a introductory statistics course. The lessons are suitable for a college introductory course or a full year high school introductory statistics course.The bundle contains the following lessons: Unit 1: -Lesson 1: Introduction to Statistics -Lesson 2: Classifying Data -Lesson 3:Experimental Design Assignments/Activity/Quizzes for each lesson Pacing guide Test Unit 2: -Lesson 4:Frequency D
Subjects:
Grades:
9th - 12th, Higher Education
Types:
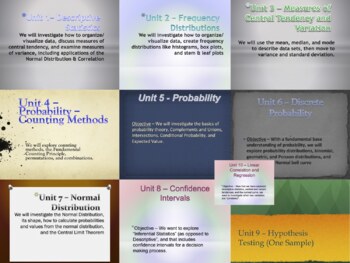
A Mountain of Statistics Curriculum - One Full Year Bundle
This is a bundle of 10 Units, Midterm Exam, & Final Exam designed for a high school Statistics Class (can be applied to University discipline). Each unit plan includes Common Core Standards, Key Concepts/Enduring Understandings, Essential Questions/Do Now, Activities, Resources, Procedures, and Assessment techniques. It is designed to be a lifelong tool that you can add to, edit, and re-use every year! Please see each Unit Statistics Product in the MountainWorks Store (sold separately) for
Subjects:
Grades:
9th - 12th, Higher Education
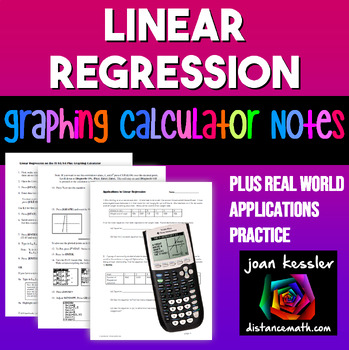
Linear Regression | TI-84 Graphing Calculator plus Applications
This clear, concise, step by step notes help your students use the TI 83 and TI 84 Graphing Calculator to enter data into lists, create a linear regression equation and to plot the equation along with the data simultaneously. Also included is a 3 page worksheet with five real world examples for students to practice. Solutions included. These can be used as Binder Notes or printed smaller for Interactive Notebooks._________________________________________________Related Products★ Quadratic Re
Subjects:
Grades:
9th - 11th, Higher Education
Types:
CCSS:
Also included in: Linear Functions and Systems Algebra 2 Unit 2 Activity Bundle
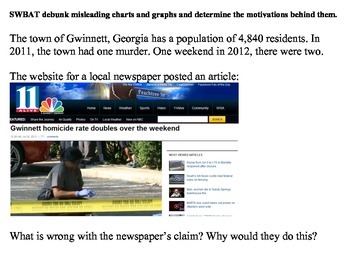
Misleading Charts and Graphs (Statistics)
Teaching students to deduce information provided in charts and graphs is an essential part of any math curriculum.
However, what do you do when the graph itself provides misleading or false information?
This lesson is a good way to get students to look critically at graphically displayed data and see through those who try to manipulate data for their own purposes.
Subjects:
Grades:
7th - 12th, Higher Education, Adult Education
Types:
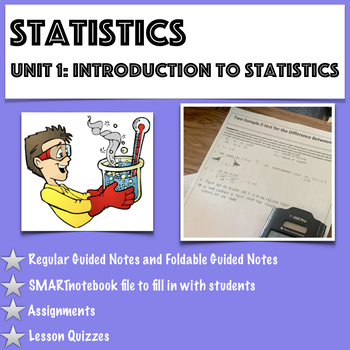
Statistics-Unit 1 Bundle: Introduction to Statistics
This bundle contains 3 lessons that introduce students to statistics. You can purchase this bundle with videos of the lessons as well. See my store. Lesson 1: Students will: -Be introduced to key vocabulary -Distinguish between a population and a sample -Distinguish between a parameter and a sample -Distinguish between descriptive statistics and inferential statisticsLesson 2: Students will: -Be introduced to key vocabulary -Determine if data are quantitative or q
Subjects:
Grades:
10th - 12th, Higher Education
Introduction to Probability and Statistics Lesson Plan Bundle
Elementary Statistics - Introduction to Probability and Statistics Lesson Plan BundleThis bundle includes:-Introduction to Statistics and Types of Data-Data Collection, Sampling Techniques, and Studies-Introduction to Technology in Statistics Activity-Organizing Data Using Frequency Distributions-Histograms and Dot Plots-Graphs and Charts in Statistics-Organizing and Presenting Data Using Technology Activity-Measures of Central Tendency-Measures of Position-Measures of Variation-Introduction to
Subjects:
Grades:
10th - 12th, Higher Education
Confidence Intervals and Hypothesis Testing Lesson Plan Bundle
Elementary Statistics - Confidence Intervals and Hypothesis Testing Lesson Plan BundleThis bundle includes:-Confidence Intervals for the Mean-Confidence Intervals for Proportions-Confidence Intervals for Variance and Standard Deviation-Introduction to Hypothesis Testing-Hypothesis Testing for the Mean-Hypothesis Testing for Proportions-Hypothesis Testing forVariance and Standard Deviations-Other Uses of Hypothesis Testing-Confidence Intervals and Hypothesis Testing Test-Confidence Intervals and
Subjects:
Grades:
10th - 12th, Higher Education
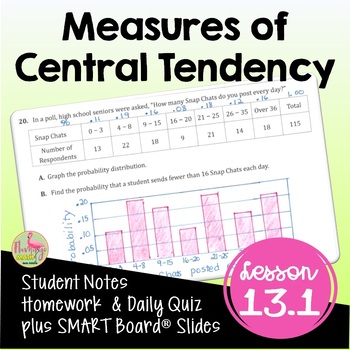
Measures of Central Tendency (Algebra 2 - Unit 13)
Measures of Central Tendency Algebra 2 Lesson:Your Pre-AP Algebra 2 Honors students will draw, analyze and interpret box-and-whisker plots, find outliers, and calculate measures of central tendency in this unit 13 lesson on Data Analysis & Statistics that cover the concepts in depth. #distancelearningtptWhat is included in this resource?⭐ Guided Student Notes⭐ Google Slides®⭐ Fully-editable SMART Board® Slides⭐ Homework/Practice assignment⭐ Lesson Warm-Up (or exit ticket)⭐Daily Content Quiz
Subjects:
Grades:
8th - 11th, Higher Education
CCSS:
Also included in: Algebra 2 Curriculum Mega Bundle | Flamingo Math
AP Statistics-Chapter 7 Bundle: Sampling Distributions
This bundle contains three lessons that cover sampling distributions. -Lesson 1: Introduction to Sampling Distributions (includes an activity) -Lesson 2: Sampling Distribution of Sample Proportions -Lesson 3: Sampling Distribution of Sample MeansDetailed Descriptions included in the individual lessons.In addition to the guided notes (foldable book notes or regular guided notes), the following is included: - An introductory activity that has students explore the concept of a sampl
Subjects:
Grades:
9th - 12th, Higher Education
Types:
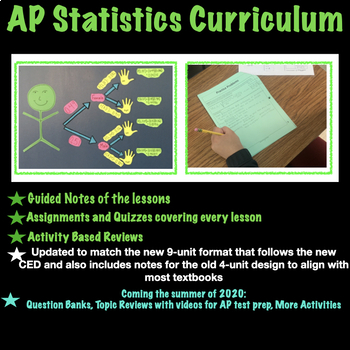
AP Statistics Mega Bundle -Whole Curriculum
This Bundle contains all that you will need to prepare your students for success on the AP® exam.I have designed these lessons over the past 12 years teaching AP Statistics. The organization and rigor of the lessons and practice have produced an AP pass rate well over the national average.I am redesigning the notes to make improvements including power point slides and keynote to present lesson. The upgrades will be free to those who have purchased this bundle. The curriculum was redesigned in 2
Subjects:
Grades:
9th - 12th, Higher Education
Find Z-Scores for Normal Distributions (Lesson with Homework)
Elementary Statistics - Find Z-Scores for Normal DistributionsCommon Core Aligned Lesson with HomeworkThis lesson plan includes:-Lesson Notes (PDF, PowerPoint, and SMART Notebook)-Blank Lesson Notes (PDF and SMART Notebook)-Normal Distribution Table (PDF)-Homework (PDF and Word)-Answer Key (PDF)You do not need to have PowerPoint or SMART Notebook to receive the full benefits of this product. There are also PDF versions included!Lesson Objectives:-Find z-scores given the area under the normal cur
Subjects:
Grades:
10th - 12th, Higher Education
CCSS:
Also included in: Distributions of Data Lesson Plan Bundle
Probability and Counting Rules Lesson Plan Bundle
Elementary Statistics - Probability and Counting Rules Lesson Plan BundleThis bundle includes:-Introduction to Probability-Addition Rules for Probability-Multiplication Rules and Conditional Probability-Notation and Symbols in Probability-Permutations and Combinations-Application of Counting Rules-Probability and Counting Rules Test-Probability and Counting Rules Quiz (Bonus File)-Sample Space Handout (Bonus File)-Pacing Guide (Bonus File)Preview: Please refer to the above links for additional p
Subjects:
Grades:
10th - 12th, Higher Education
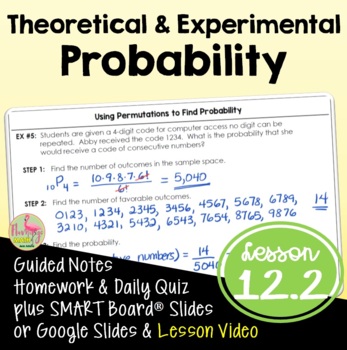
Theoretical and Experimental Probability (Algebra 2 - Unit 12)
Theoretical & Experimental Probability Algebra 2 Lesson:Your Pre-AP Algebra 2 Honors students will find both experimental and theoretical probabilities in this Unit 12 lesson. #distancelearningtptWhat is included in this resource?⭐ Guided Student Notes⭐ Google Slides®⭐ Fully-editable SMART Board® Slides⭐ Homework/Practice assignment⭐ Lesson Warm-Up (or exit ticket)⭐ Daily Content Quiz (homework check)⭐ Video Lesson Link for Distance Learning - Flipped Classroom models⭐ Full solution setStude
Subjects:
Grades:
8th - 11th, Higher Education
CCSS:
Also included in: Algebra 2 Curriculum Mega Bundle | Flamingo Math
Multiplication Rules and Conditional Probability (Lesson with Homework)
Elementary Statistics - Multiplication Rules and Conditional ProbabilityCommon Core Aligned Lesson Plan HomeworkThis lesson plan includes:-Lecture Notes (PDF, PowerPoint, and SMART Notebook)-Blank Lecture Notes (PDF and SMART Notebook)-Homework (PDF and Word)-Answer Key (PDF)-Conditional Probability Demonstration Handout (PDF and Word)You do not need to have PowerPoint or SMART Notebook to receive the full benefits of this product. There are also PDF versions included!Lesson Objectives:-Find the
Subjects:
Grades:
10th - 12th, Higher Education
CCSS:
Also included in: Probability and Counting Rules Lesson Plan Bundle
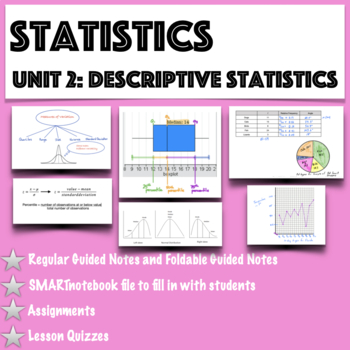
Statistics- Unit 2 Bundle: Describing Statistics
This is the second unit in my statistics curriculum. It contains 5 lessons. All lessons come with an assignment, quiz, and keys.Lesson 4: Frequency Distributions Students will: -Be introduced to key vocabulary -Create a frequency distribution -Make a histogram, a frequency polygon, and an ogiveLesson 5Students will: -Be introduced to key vocabulary -Graph quantitative using stem and leaf plots and dot plots -Graph qualitative data using a pie chart and pareto charts
Subjects:
Grades:
9th - 12th, Higher Education
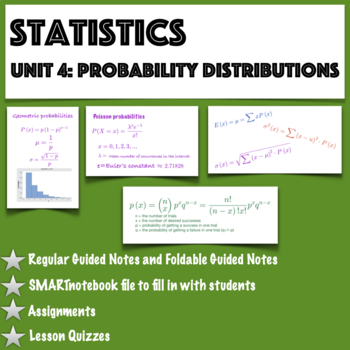
Statistics - Unit 4 Bundled: Probability Distributions
This bundle covers three lessons on Probability Distributions. -Lesson: Probability Distributions -Lesson: Binomial Distributions -Lesson: Geometric and Poisson DistributionsFor detalied information on lessons see the individual lesson descriptions.In addition to guided notes (foldable or regular guided notes), the following is included: -SMARTnotebook files for the teacher to fill in with the students -Homework/Classwork -Lesson quizzes -2 Tests© 2015 Angela Hogan “Stat
Subjects:
Grades:
9th - 12th, Higher Education
AP Statistics - Unit 2 Bundled: Descriptive Statistics (Growing Bundle)
This bundle will be updated with new improved notes, assignments, and daily quizzes that align with College Boards new course outline. Will be fully updated in July (2019).This growing bundle contains all of the lessons in the Descriptive Statistics Unit for AP Statistics. There are 13 lessons: -Analyzing Categorical Data (lesson 1) -Displaying Quantitative Data (lesson 2) -Using numbers to describe Quantitative Data (lesson 3) -Using numbers to describe Quantitative Data #2 (le
Subjects:
Grades:
9th - 12th, Higher Education
Introduction to Factorials and Permutations Presentation, Notes & Practice
Focus of Lesson: Calculate factorials and use the permutation formula.
Lesson: Use the PowerPoint presentation with layered animation accompanied by a whole class discussion.
Alternate Lesson: Does your school have one-to-one computing? Have students view the presentation on their own device. This option allows students to proceed at their own pace and ask the teacher for clarification as needed.
Presentation: Slides 1-3
Student Note-taking Outline: Slides 4-5
20 Practice Problems: Slides
Subjects:
Grades:
8th - 12th, Higher Education
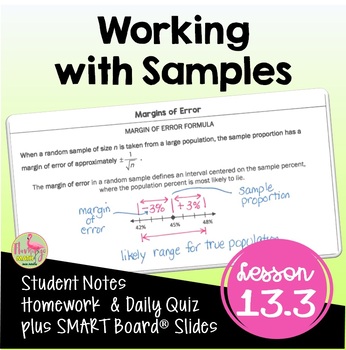
Working with Samples (Algebra 2 - Unit 13)
Working with Samples Algebra 2 Lesson:Your Pre-AP Algebra 2 Honors students will find draw, analyze and interpret box-and-whisker plots, find outliers, and calculate measures of central tendency in this unit 13 lesson on Data Analysis & Statistics that cover the concepts in depth. #distancelearningtptWhat is included in this resource?⭐ Guided Student Notes⭐ Google Slides®⭐ Fully-editable SMART Board® Slides⭐ Homework/Practice assignment⭐ Lesson Warm-Up (or exit ticket)⭐Daily Content Quiz (ho
Subjects:
Grades:
8th - 11th, Higher Education
CCSS:
Also included in: Algebra 2 Curriculum Mega Bundle | Flamingo Math
AP Statistics- Chapter 8 Bundle: Confidence Intervals
Students will: -use point estimates to construct confidence intervals -find the point estimate and margin of error given an interval -interpret a confidence interval -they will be introduced to critical values -note the conditions for calculating a confidence interval for proportions and means -calculate critical values using tables or technology -build and interpret confidence intervals for proportions -calculate the sample size required to obtain a C% con
Subjects:
Grades:
9th - 12th, Higher Education
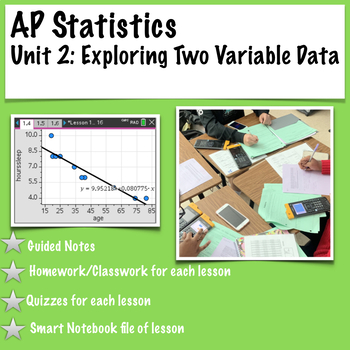
AP Statistics. Unit 2: Exploring Two Variable Data
This bundle will contain 8 lessons that cover bivariate data. College Board® Topics 2.1-2.9 are covered in these lessons;Lesson 11: Representing Two Categorical VariablesLesson 12: Statistics for Two Categorical Variables Lesson 13: Representing the Relationship Between Two Quantitative VariablesLesson 14: CorrelationLesson 15: Linear Regression ModelLesson 16: ResidualsLesson 17: Least Squares Regression Lesson 18: Departures form Linearity Unit 2 Test Covering lessons 13-18Included in this dow
Subjects:
Grades:
9th - 12th, Higher Education
Showing 1-24 of 564 results


