TI-84 CALCULATOR ACTIVITY - Data, Scatterplots, Regression & Line of Best Fit
Algebra is My Domain
882 Followers
Grade Levels
7th - 12th, Higher Education, Homeschool
Subjects
Resource Type
Standards
CCSSHSS-ID.B.6
CCSSHSS-ID.B.6c
CCSSHSS-ID.C.7
CCSSHSS-ID.C.8
Formats Included
- PDF
Pages
24 (including solutions)
Algebra is My Domain
882 Followers
What educators are saying
Thanks, I used this as a "final" project for the fall semester. We had just finished linear equations, this made a great application of technology for them.
Description
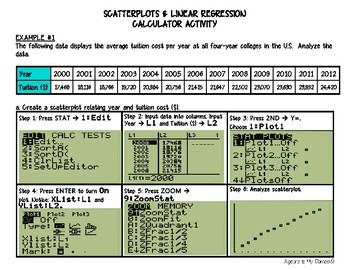
This file includes four linear regression examples (all real-life data). The examples cover the following topics for the TI-84 graphing calculator:
* Creating a scatterplot
* Performing linear regression (finding the equation of the best-fit line)
* Interpreting the slope of the equation
* Calculating and interpreting the correlation coefficient
* Predicting values (using the linear regression equation)
The first example gives the step-by-step instructions to calculate all the necessary values. Students will be guided through the example, and they will see the calculator screen they should see every step of the way.
A great collaborative group activity!
***SOLUTIONS INCLUDED!***
Try the following related product:
* WORKSHEET / QUIZ - Scatterplots & Linear Regression
Total Pages
24 (including solutions)
Answer Key
Included
Teaching Duration
2 hours
Report this resource to TPT
Reported resources will be reviewed by our team. Report this resource to let us know if this resource violates TPT’s content guidelines.
Standards
to see state-specific standards (only available in the US).
CCSSHSS-ID.B.6
Represent data on two quantitative variables on a scatter plot, and describe how the variables are related.
CCSSHSS-ID.B.6c
Fit a linear function for a scatter plot that suggests a linear association.
CCSSHSS-ID.C.7
Interpret the slope (rate of change) and the intercept (constant term) of a linear model in the context of the data.
CCSSHSS-ID.C.8
Compute (using technology) and interpret the correlation coefficient of a linear fit.


