132 results
Higher education graphing lessons
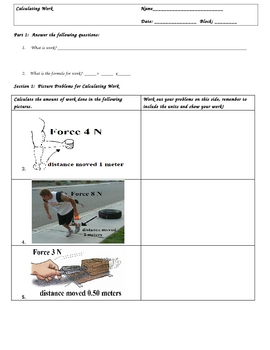
Calculating Work (W=Fxd) Worksheets and Key
Calculating Work (W=Fxd) Worksheets and KeyIf you have been teaching a Simple Machines or Energy Unit, then you need to check out this three page lesson to teach calculating work. It is in three sections.Section 1: Picture QuestionsSection 2: Word Problems/with Challenge QuestionsSection 3: Charting/Graphing ProblemsAll problems are worked out and the key is included.These worksheets include the renown Triangle Method, which has been a proven problem solver for students who struggle in math.The
Subjects:
Grades:
3rd - 12th, Higher Education, Adult Education
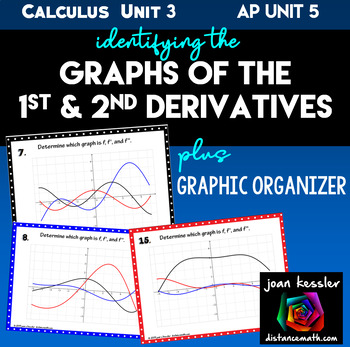
Identifying and Matching the Graphs of First & Second Derivatives, f, f', f''
In this activity students practice identifying the Graphs of f, f ', and f ''. Students analyze three graphs, one blue, one black, and one red, superimposed on the same coordinate grid to determine which is the graph of original function, the graph of first derivative, and the graph of the second derivative. The activity does not require differentiation, but requires students to understand increasing, decreasing, relative extrema, and concavity. Many of the examples will lead to great discuss
Subjects:
Grades:
10th - 12th, Higher Education
Types:
Also included in: Calculus Applications of Differentiation Unit Bundle
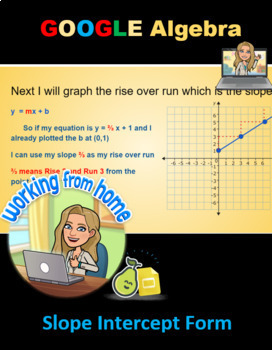
Slope Intercept Form Pear Deck Algebra Google Activity Distance Learning
This 26 slide pear deck product contains a mini lesson embedded with step by step checks for understanding.Includes:- Introducing y = mx + b format- Identifying slope from formula- Identifying y - intercept from formula- Recognizing y - intercept coordinates- Stating the coordinate from a graph and formula- Graphing linear equations from an equation- Matching an equation to a graph
Grades:
6th - 12th, Higher Education
Types:
Also included in: Pear Deck Algebra 1 Summer School Google Activity Bundle NO PREP Digital
Graphing Quadratic Functions Escape Room - Algebra 1 & 2
**SEE THE PREVIEW AND FIND OUT FOR YOURSELF WHY WE ARE THE ORIGINAL AND THE #1 ESCAPE ROOM MATERIAL USED BY THOUSANDS OF TEACHERS AND SCHOOLS**INCLUDES: 1) Escape Room Activity2) Handout Material3) Lesson Plan On Subject 4) Power Point Presentation5) Promotional Videos 6) How-To Video7) Count Downs 8) Test **The interactive nature of our videos set us apart from all other curriculum sources. Students LOVE our Super Villains, and will beg you for more. When was the last time your students begged
Subjects:
Grades:
9th - 12th, Higher Education
Types:

PreCalculus Interactive Graphing Bundle and Math Clip Art Tool
Amazing tools to engage your PreCalculus students (and yourself). Interactive Live Graphs from your computer. Project onto a whiteboard or SmartBoard® or just play with the graphs on your own. So easy to use, you will be up and running in less than five minutes. Also runs from a Flash Drive, no need to worry about admin installs. Each applet (notebook) is completely editable. Highlight, retype, voila new graph - that's it!! Drag the window, zoom in and out,. Mess up? Close and reopen
Subjects:
Grades:
11th - 12th, Higher Education
Types:
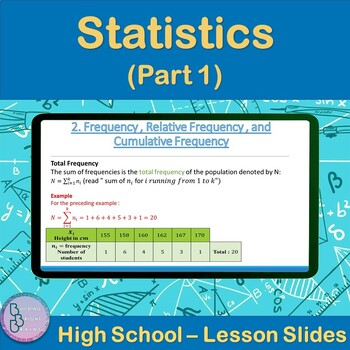
Statistics Part 1 | High School Math PowerPoint Lesson Slides
Are you teaching your High School students about Statistics? Plenty of examples and application exercises are included. You can also easily convert this to a Google Slides lesson by dragging it into your Google Drive.What is included?✦ 30 total slides for notes, examples and applications.✦ All steps are animated to allow the teacher to explain them gradually. Throughout the Lesson, students will be introduced to the following:✦ Statistics Vocabulary✦ Frequency , Relative Frequency , and Cumulati
Subjects:
Grades:
10th - 12th, Higher Education
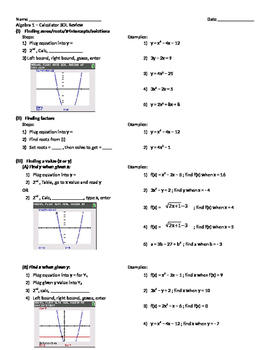
Algebra 1 Calculator Review (TI-84)
Comprehensive review of all graphing calculator concepts taught through the Algebra 1 course. Review concepts include finding roots, factors, values (x or y), y-intercept, mean, standard deviation, line/curve of best fit, and finding solutions to systems of equations. The review include steps and screenshots of the calculator.
Subjects:
Grades:
7th - 12th, Higher Education, Adult Education
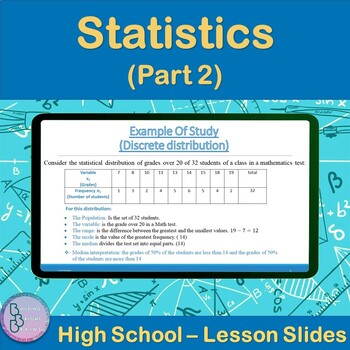
Statistics Part 2 | High School Math PowerPoint Lesson Slides
Are you teaching your High School students about Statistics (Part 2)? Plenty of examples and application exercises are included. You can also easily convert this to a Google Slides lesson by dragging it into your Google Drive.What is included?✦ 18 total slides for notes, examples and applications.✦ All steps are animated to allow the teacher to explain them gradually. Throughout the Lesson, students will be introduced to the following:✦ Statistical Vocabulary✦ Discrete distribution✦ Continuous d
Subjects:
Grades:
10th - 12th, Higher Education
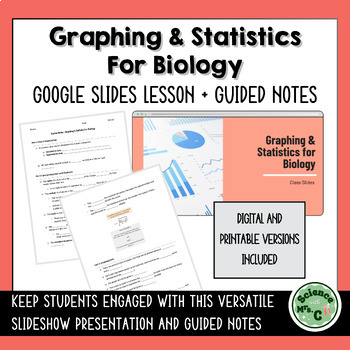
Graphing and Statistics for Biology Google Slides + Guided Notes
Keep your students engaged and accountable with this BUNDLE that includes a google slides presentation AND corresponding guided notes. Students can use these slides and notes to complete as an assignment, use as a study guide, or to simply to guide them through a lesson in the classroom and at home.The topics covered in this presentation include:Identifying types of DataConstructing Data TablesCalculating Mean, Median, Mode, Range & Standard DeviationPlotting a GraphInterpolation & Extra
Subjects:
Grades:
6th - 12th, Higher Education
Types:

Stained-Glass - Exponential and Logarithmic Inverses
This project integrates exponential and logarithmic inverses with art in a unique way to keep students engaged. You can either assign Version A of the project to students or, if your students are more advanced, you can assign Version B. This project is fully customizable.The suggested rubric, teacher instructions, and answer key for Version A are included. There is not an answer key for Version B, as answers will vary.
Subjects:
Grades:
9th - 12th, Higher Education
Types:
CCSS:
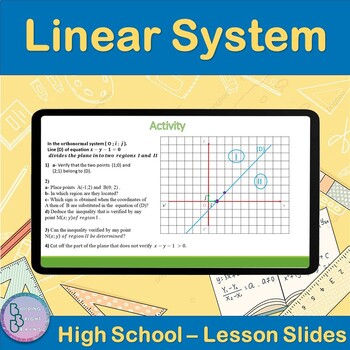
Linear System | High School Math PowerPoint Lesson Slides
Are you teaching your High School students about Linear System? Plenty of examples and application exercises are included. You can also easily convert this to a Google Slides lesson by dragging it into your Google Drive.What is included?✦ 17 total slides for notes, examples and applications.✦ All steps are animated to allow the teacher to explain them gradually. Throughout the Lesson, students will be introduced to the following:✦ Algebraic method of solving✦ Substitution Method ✦ Comparison Met
Grades:
10th - 12th, Higher Education
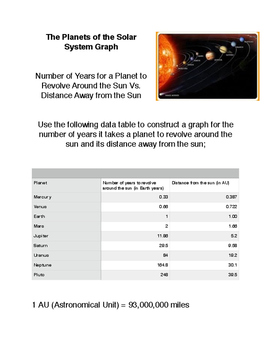
The Planets of the Solar System Graph
The Planets of the Solar System Graph is a graphing activity in which students will create a graph based on the distances of the planets in the solar system and the time it takes for each of the planets to revolve around the sun. Students will analyze the graph and draw a conclusion based on their evidence.
Subjects:
Grades:
5th - 12th, Higher Education, Adult Education
Types:
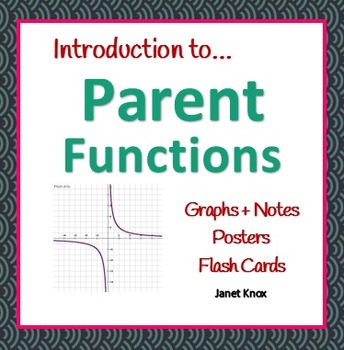
Introduction to Parent Functions: Lesson, Posters, Flash Cards
Features large graphs, notes, bulletin-board posters, flash cards, and a study sheet for a linear, quadratic, absolute-value, cubic, rational, and square root parent function.
Posters have thick, bold graphs with a decorative border. Notes address domain, range, end behavior, vertex, inflection point, and asymptotes. Flash cards have graphs on front, equations on the back.
**Click the preview to see a sample.**
Related products…
Activity Bundle: Parent Functions and Transformations, 50%
Subjects:
Grades:
9th - 11th, Higher Education
Types:
CCSS:
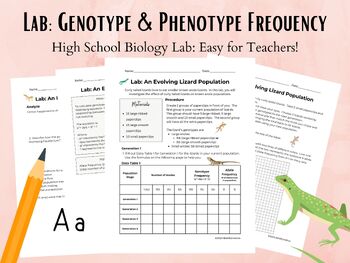
Lab: Genotype and Phenotype Frequency in Lizard Populations
This is a High School Biology lab where students will model changes in a populations traits. They will calculate genotype and phenotype frequency and monitor its changes over the course of 4 generations of lizards. Students will use A data table2 line graphthe Hardy Weinberg formula for genotype frequency Answer analysis questions. Teacher setup is minimal. Supplies are inexpensive and easily found in schools or at an office supply store. NGSS Standard CoveredLS3: Heredity: Inheritance and Var
Grades:
9th - 12th, Higher Education
Types:
CCSS:
NGSS:
HS-LS3-3

Calculus Area Under a Curve TI-84 Calculator Reference Sheets and Practice
With this Calculus Graphing Calculator clear, concise reference sheet, your students learn to use the TI Graphing Calculator to determine the Area under a Curve. These can be used as Binder Notes or printed 2 to a page for Interactive Notebooks. Also included are practice problems for students and a key.______________________________________________________________ You may also like: ★ Calculus: Bundle of Activities for Area Under and Between Curves ★ Calculus Area Between Curves Task Cards
Grades:
10th - 12th, Higher Education
Types:
Also included in: Calculus Bundle of 15 Activities and Resources

Geometry Test Bundle
Need Geometry unit tests? Study guides? 60-minute group work? Preparation for SAT, PARCC, or other CCSS-aligned state exams? Look no further! This bundle includes TEN 25-question-long tests, most of which have 20 multiple choice and 5 short response or extended constructed response questions. All tests have an answer key included. Topics covered range pretty much the full year of a standard to advanced high school CCSS Geometry course, and major topics include:
- Definitions of Key Geometry Conc
Subjects:
Grades:
8th - 12th, Higher Education
Types:

Simulation Classroom Economy Lesson Plan
This lesson plan is for a fifth or possible sixth grade economics unit. The lesson is specially designed to be a part of an economics unit which requires or needs a simulation. The lesson plan includes critical questions, currency template, simulation record sheet and step-by-step instructions on how to set up your classroom. This lesson plan will make your classroom economy simulation meaningful, integrated, value based, challenging and active (MIVCA).
Subjects:
Grades:
4th - 12th, Higher Education
Types:
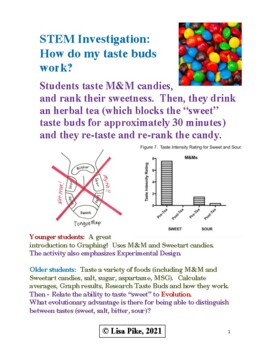
The NEW Taste Test - Blocks Taste Receptors, Students Learn Graphing/Analysis
Focus Question:How do we perceive flavor?How do our taste buds work?Conceptual Understanding: Plants and animals have physical characteristics that allow them to receive information from the environment. Structural adaptations within groups of plants and animals allow them to better survive and reproduce. This is NOT your old fashioned Tongue map (debunked) - but an actual experiment where taste receptors are blocked temporarily. Students learn about taste, and older students learn about tast
Subjects:
Grades:
3rd - 12th, Higher Education, Adult Education
Types:
NGSS:
4-LS1-1
, MS-LS1-3
, MS-LS1-1
, HS-LS4-2
, MS-LS1-4
...
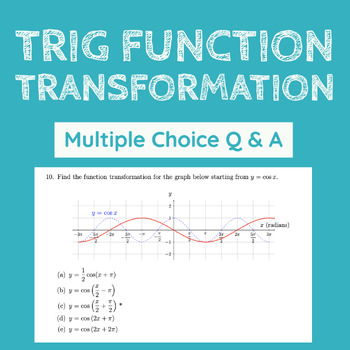
Trig Function Transformation Graphing Worksheet Multiple Choice Q & A
This pdf file gives students the opportunity to practice function transformation of trig functions (sine and cosine) in a multiple choice format. There are 14 questions in total. The types of function transformation included are:vertical stretch, horizontal stretch vertical and horizontal shiftreflections about x-axis and y-axis+ combination of these transformationsThe first page also includes a brief review of function transformation.The questions increase in difficulty level as you progress.Ea
Subjects:
Grades:
11th - 12th, Higher Education, Adult Education
Types:
CCSS:
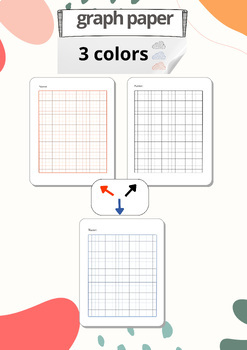
Writing Paper, Math Graph Paper, Lined Papers 3 colors_15 pages
Sketch paper is a type of paper specially designed for use in drawing layouts and engineering drawings. This type of paper has properties that make it suitable for technical and engineering purposes. Here's a description of graph paper and its uses_simple graph paper for math and scienceIts uses: Math calculationsو Learn calligraphyوGraphical curves Graphicsو Engineering drawings وGeographic mapping وMechanical circuitو designو Drawing electricity diagramsو Environmental mapping-portrait exerc
Grades:
5th - 12th, Higher Education, Adult Education, Staff
Types:
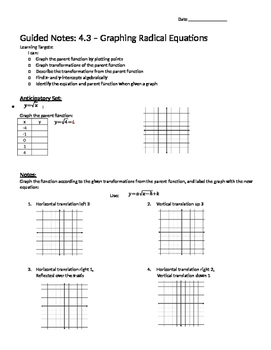
Graphing Square and Cube Root Functions - Notes
Guided notes teaching how to graph square root and cube root functions by translating the parent function. I teach my students to use the "base points" [ (0, 0), (1, 1), and (4, 2) or (-1, -1) for square/cube root] and then transform them using (h, k) or vertex form. They also must be able to determine transformations and equations from a graph. The notes are a summation of the whole unit so they must graph equations at the end and also find the domain/range as well as find x- and y-intercepts a
Subjects:
Grades:
9th - 12th, Higher Education, Adult Education
Types:
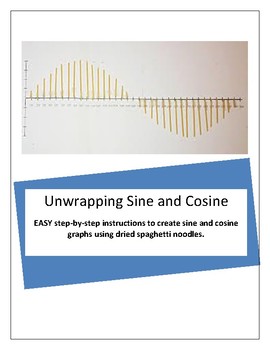
Unwrapping Sine and Cosine
EASY step-by-step instructions to create sine and cosine graphs using dried spaghetti noodles. Students read and follow steps. Includes pictures and questions for students. My students' favorite activity of the year!
Subjects:
Grades:
10th - 11th, Higher Education
Types:
CCSS:
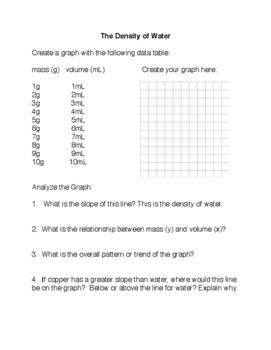
NGSS Constructing and Analyzing Density Graphs
Constructing and Analyzing Density Graphs is a NGSS collection of 11activitities that allow students to practice their graphing skills. They will analyze the data in their graphs to determine the slope of the line, the density of the substance, and to draw conclusions about their data.
Subjects:
Grades:
6th - 12th, Higher Education, Adult Education
Types:
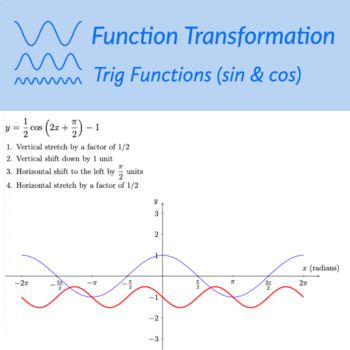
Transformation of Trigonometric Functions (Sine & Cosine) Graphing Worksheet
This pdf file gives students the opportunity to practice function transformation of trig functions (sine and cosine). There are 10 questions in total. The types of function transformation included are:- vertical stretch, horizontal stretch - vertical and horizontal shift- reflections about x-axis and y-axisThe first page also includes a brief review of function transformation.The worksheet increases in difficulty level as it progresses.Each question also includes a graph of either sin(x) or cos(
Subjects:
Grades:
11th - 12th, Higher Education, Adult Education
Types:
CCSS:
Showing 1-24 of 132 results


