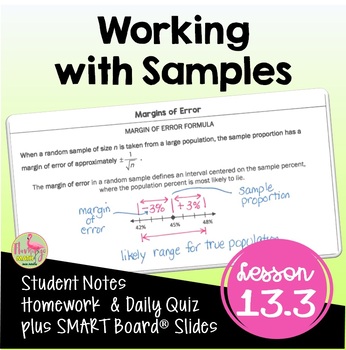
Working with Samples (Algebra 2 - Unit 13)
- Zip
Also included in
- ALGEBRA 2 CURRICULUM MEGA BUNDLE What does the curriculum include?This resource is designed for students enrolled in ALGEBRA 2 HONORS. You will find more than 1900+ pages of instructional content (warm-ups, Guided Notes and Foldables, Google Slides, SMART Board slides, video lessons, homework, dailPrice $535.00Original Price $675.44Save $140.44
- This is a MEGA Bundle of GUIDED NOTES WITH VIDEO LESSONS for your distance learning needs, homework, daily warm-up, content quizzes, mid-unit and end-unit assessments, review assignments, and cooperative activities for Algebra 2 Honors UNIT 13: DATA ANALYSIS & STATISTICS. #distancelearningtpt⭐GuPrice $41.60Original Price $52.00Save $10.40
Description
Working with Samples Algebra 2 Lesson:
Your Pre-AP Algebra 2 Honors students will find draw, analyze and interpret box-and-whisker plots, find outliers, and calculate measures of central tendency in this unit 13 lesson on Data Analysis & Statistics that cover the concepts in depth. #distancelearningtpt
What is included in this resource?
⭐ Guided Student Notes
⭐ Google Slides®
⭐ Fully-editable SMART Board® Slides
⭐ Homework/Practice assignment
⭐ Lesson Warm-Up (or exit ticket)
⭐Daily Content Quiz (homework check)
⭐ Video Lesson Link for Distance Learning - Flipped Classroom models
⭐ Full solution set
Students will be able to:
★ Find range, interquartile range, standard deviation of a set of data, variance, z-scores
★ Use standard deviations to help interpret representations of real-world applications
The unit includes the following topics:
1) Measures of Central Tendency
3) Working With Samples
You may also be interested in:
Data Analysis Activities & Assessments
Data Analysis Stations Activity
*************************************************************************************************************
⭐For updates about sales and new products, please follow my store: My TpT Store
You can also
⭐Subscribe to my newsletter for freebies and teaching tips
⭐Follow me on Instagram
⭐Check out my Facebook page
⭐Follow me on Pinterest
I value your feedback. Please rate this product. If you have any issues or questions about this product, please feel free to ask a question in my store or write to me at jean@flamingomath.com
Thanks for shopping in my store!
Jean Adams


