32 results
Not grade specific statistics lessons
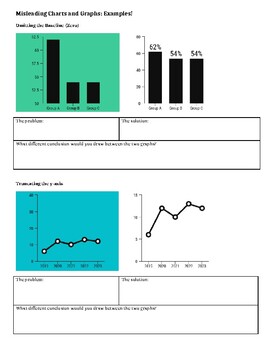
Misleading Charts and Graphs Analysis
This lesson outlines the four most common ways that writers and journalists display graphs that can cause people to draw incorrect conclusions. Students look at examples of bad graphs along with corrected versions and explain why one version is misleading and the other is correct. Independent practice is provided for the students to demonstrate understanding as well.
Subjects:
Grades:
Not Grade Specific
Types:
Intro to Data Analysis Interactive Lesson *Any Level* Mean, Median, Mode & Range
Are you introducing your students to concepts like data sets, mean, median, and mode?Do you want your students to actually understand the meaning of these terms, not just see them as meaningless, unimportant, abstract words in a math textbook?Do you want your students to understand that calculating mean, median, mode, and range is actually useful, not just pointless math exercises?This may be the perfect lesson for you!This lesson is fully complete and ready to use, based on well-researched peda
Subjects:
Grades:
Not Grade Specific
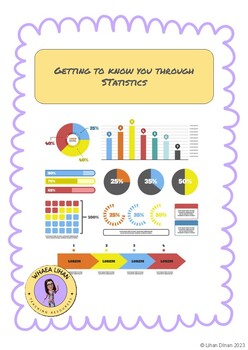
Getting to know you through statistics
Getting to know you through statistics, getting to know your students at the beginning of the teaching year can often resort to the tried and true activities. Why not try something new and find out more about your students likes/dislikes, interests, hobbies through learning. This resources supports you and your students to work through statistics, and working through the PPDAC cycle. It gives you options for making graphs as well as using digital platforms to create your graphs and show your dat
Subjects:
Grades:
Not Grade Specific
Types:
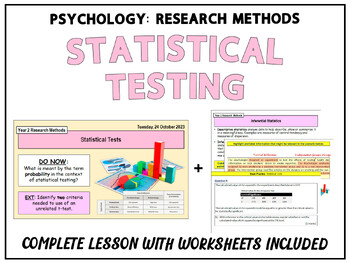
RESEARCH METHODS IN PSYCHOLOGY: Statistical Testing
To request lessons, provide feedback or if you have had any issues opening any resources of my resources, please feel free to contact me on jb_resources@outlook.com (responses are usually very prompt).Key content covered in this Lesson:Key QuestionsDescriptive vs. Inferential StatisticsInferential Statistics in PsychologyStatistical Tests: Wilcoxon, Related t-test, Chi-squared, Mann Whitney, Unrelated t-test, Spearman's Rho, Pearons rLearning the Decision TreeWhen to Use Parametric TestsStatisti
Subjects:
Grades:
Not Grade Specific
Also included in: RESEARCH METHODS IN PSYCHOLOGY [UNIT 2 COMPLETE MODULE]
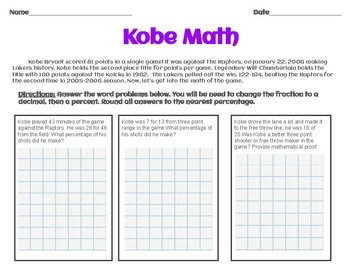
Fractions to Percent Word Problems (Kobe Edition)
This worksheets is about finding percentages in word problems with a real word situation. In this worksheet the student will use data from Kobe Bryant's 81 point game and assess his performance. Students will have to find out the percentage of three word problems.
Subjects:
Grades:
Not Grade Specific
Types:
Univariate Stats: Frequency Distribution Table, Animated PPW & Knowledge Checks
This Univariate Statistics: Frequency Distribution Table resource contains an interactive and animated PowerPoint for your scientific method or statistics unit. You can also purchase the matching scaffolded notes. There is a Tip & Tricks slide and corresponding note page that compiles feedback, notes, and helpful information I have personally seen benefit my students.Please be aware that this lesson was designed for a criminal justice-based statistics course; as such, topics and applied word
Subjects:
Grades:
Not Grade Specific
CCSS:
NGSS:
MS-LS4-6
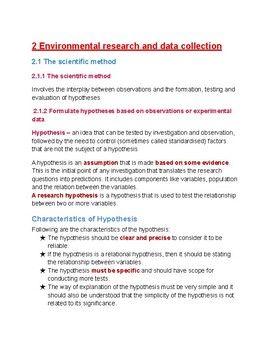
Environmental research and data collection
Strictly follows the A-level Cambridge Environmental management new syllabus for examinations from 2022. A great resource for both teachers and students- a remedy since Cambridge has no resource yet for this syllabus. It is also useful for any environmental studies, Biology and even Geography at all levels. This resource covers-The scientific methodFormulate hypothesesCharacteristics of HypothesisDesign investigations in which variables are controlled and quantitative results are collecteddepend
Subjects:
Grades:
Not Grade Specific

Statistics Problems with Worked Solutions
Each book in our series of worked problems contains hundreds of problems with answers, and detailed solutions.The answers are separate from the solutions since many students just want to know that their answer is wrong before trying the problem again.Titles in the series: 1. Pre-Algebra Problems with Worked Solutions2. Algebra Problems with Worked Solutions3. Pre-Calculus Problems with Worked Solutions4. Calculus Problems with Worked Solutions5. Statistics Problems with Worked SolutionsPlease no
Subjects:
Grades:
Not Grade Specific
Types:
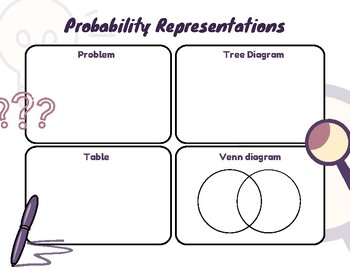
Visual Representations of Probability Graphic Organizer
Graphic Organizer for teaching visual representations of probability. Tree DiagramArea Model (table)Venn DiagramExample of completed sheet included.
Subjects:
Grades:
Not Grade Specific

Constants, Variables, & Level of Measurement Animated PPW, Knowledge Checks
This constants, variables, and level of measurement resource contains an interactive and animated PowerPoint for your scientific method or statistics unit. You can also purchase the matching scaffolded notes. There is a Tip & Tricks slide and corresponding note page that compiles feedback, notes, and helpful information I have personally seen benefit my students.Please be aware that this lesson was designed for a criminal justice-based statistics course; as such, topics and applied word prob
Subjects:
Grades:
Not Grade Specific
CCSS:
NGSS:
HS-LS3-3
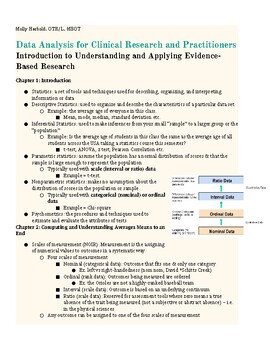
Editable Clinical Research/ Data Analysis Lecture Notes for a Full Semester!
I created this editable lecture material and study guide while taking Data Analysis in graduate school for my master's in occupational therapy. This simple-to-understand guide looks over the basics of research while applying the basics using a clinical lease. This study guide is excellent for all students taking introductory statistics courses, data analysis, or clinical research. The specific graduate programs that would benefit from this include but are not limited to:Occupational TherapyPhysi
Subjects:
Grades:
Not Grade Specific
Types:

Independent Variables, Dependent Variables, & Contingency Tables, Animated PPW
This Independent Variables, Dependent Variables, & Contingency Tables resource contains an interactive and animated PowerPoint for your scientific method or statistics unit. You can also purchase the matching scaffolded notes. There is a Tip & Tricks slide and corresponding note page that compiles feedback, notes, and helpful information I have personally seen benefit my students.Please be aware that this lesson was designed for a criminal justice-based statistics course; as such, topics
Subjects:
Grades:
Not Grade Specific
CCSS:
NGSS:
MS-PS3-4
, 5-PS1-3
, 5-PS1-4
, HS-PS3-4
, HS-PS2-5
...

Teaching with Baseball Statistics
I use this activity to teach my science students how to model an idea using data. Students learn to predict the outcomes of a baseball pitcher based on their last 3 years of stats. Students learn to analyze their data and determine trends in the data. Students also learn to compare data from their pitcher to other students' pitchers (collaboration). Students also must be able to/learn to accurately graph their data. There is also a research component as students must research their pitcher's
Printable Graphs
Use these graphs for gathering data. This set includes a tally chart and bar graph option. I have used this with my students when studying graphing, gathering data for experiments, getting to know our class and more. These graphs have fill in the blank spots to fill in the appropriate data. Be sure to check out my other products from Katie's Creative Classroom! Enjoy :)
Subjects:
Grades:
Not Grade Specific
Types:
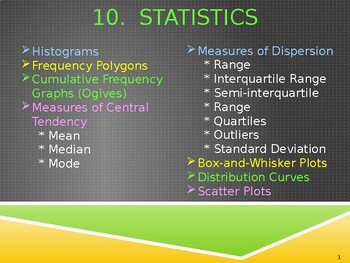
Grade 11 Maths: Statistics in PowerPoint
Histograms, frequency polygons, cumulative frequencies, graphs, measures of central tendency - mean, median & mode, measures of dispersion, box-and-whisker plots, distribution curves, scatter plots, explanations, examples and exercises. Excellent for classroom teaching with a data projector & use on mobiles.
Subjects:
Grades:
10th - 12th, Not Grade Specific
Also included in: G 11 Maths: Statistics, finance growth and decay in animated PowerPoint.
Computing the Variance and Standard Deviation of Grouped Data
Students read instructions on how to analyze the spread of a set of grouped data using the formulas for variance and standard deviation. Then students get to try their hand at computing the variance and standard deviation of other sets of data.
Subjects:
Grades:
Not Grade Specific

Term Maths Planning. Topics include: Money, Stastics, Fractions and Decimals.
Term lesson planning, topics include; money, statistics, fractions and decimals. Designed to introduce students to the topic. Differentiation for more HA (able) students.
Suitable for KS1, Pre K, Grade 1-6 and Students with Special Educational Needs.
Thank you and happy teaching....
Subjects:
Grades:
Not Grade Specific
Types:

Fun Friday Polls (Food)
Do you do Fun Friday activities? These polls are based upon some of kids favorite foods and resturants. Countless opportunities with this activity from ice-breakers to incorporating a math lesson with percents and fractions.
Subjects:
Grades:
Not Grade Specific
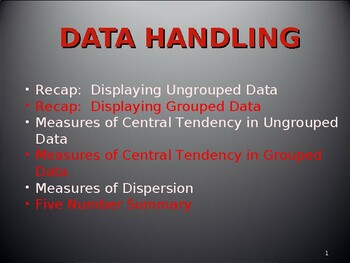
Grade 10 Maths: Statistics in PowerPoint.
Displaying ungrouped data, displaying grouped data, measures of central tendency in ungrouped data, measure of central tendency in grouped data, measures of dispersion, five number summary, examples & exercises. Excellent for classroom teaching & for use on mobiles.
Subjects:
Grades:
9th - 11th, Not Grade Specific
Also included in: G 10 Maths Statistics and probability in animated PowerPoint.
Grade 12 Statistics in PowerPoint
Measures of central tendency & spread, five-number summary, distribution data & curve, skewed to the right distribution & curve, scatter plots with positive negative and no correlation, least squares regression line, predictions using the line of best fit, correlations, interpreting correlation coefficient, positive strong correlation, negative & weak correlation, no correlation. Excellent for classroom teaching with a data projector and also can be used on a mobile phone.
Subjects:
Grades:
11th - 12th, Not Grade Specific
Also included in: G 12 Maths: Statistics, counting and probability in animated PowerPoint.
Data Statistics with Candy
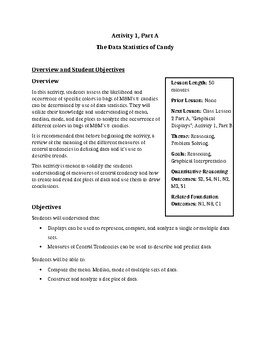
This is a 4 activity lesson. It was created to follow along with The Dana Center Quantitative Reasoning resources but can be used as a stand-alone activity series. Provided are lesson plans with activity papers for students to complete work on. The lesson activities follow each other well and were created to develop a student's understanding of the basics of data statistics including measures of central tendency, box and whisker plots, cumulative curve percents, and even probabilities. The activ
Subjects:
Grades:
Not Grade Specific

A begginers guide to SEO for blogs and websites.
This is a blueprint of a beginner's guide to SEO for websites and blogs - parts one and two. This is what we followed for our www.tourandtakein.com.Thus giving us a great domain authority score on articles and the site as per attachedThis enables your articles to reach the top pages in most search engines, thus increasing traffic and a bigger audience. We aim for the top ten pages of Google!More parts to follow, email us if you need more before we publish..
Grades:
Not Grade Specific

Who is the Bowling Master?
In this activity, students will have the opportunity to evaluate scores of bowlers presented in histogram charts. Learning concepts to be applied include: minimum, maximum, mean, median, and more...
Subjects:
Grades:
Not Grade Specific
Types:

CLOSED ECONOMY- ONE PERIOD MODEL OF ECONOMY
Concise and to the point lessons about the Closed Economy One period Model
Subjects:
Grades:
Not Grade Specific
Types:
Showing 1-24 of 32 results


