157 results
Adult education statistics lessons
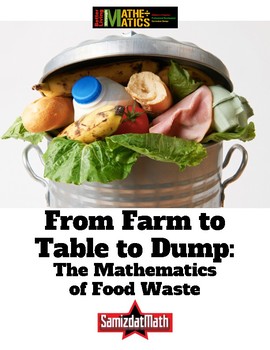
Food Waste and Mathematics: From Farm to Table to Dump
Here's a very uncomfortable fact: it takes 4 pounds of potatoes to make 1 pound of potato chips. That means that for every 1 pound bag of potato chips you eat, 3 pounds of potatoes have to be thrown away. What a waste of food! This is a series of activities that looks at the hidden world of food waste. It includes a look at how much food is wasted as it is "processed" into finished products like french fries and potato chips. It also includes mathematical activities where students calculate how
Subjects:
Grades:
5th - 12th, Adult Education
Types:
Interpreting Graphs for the Middle & Junior High School: Book 2
Here is another set of data graphics for your students to analyze and interpret. Using survey results from the USA Today newspaper, students will be asked to explain what the graphics are illustrating. Each activity will ask the student to identify basic information presented in each graphic and make some projections based on the data given in the survey.
The activities in this packet are a great way to improve your student’s skills in taking apart graphic displays of information. Brin
Subjects:
Grades:
4th - 10th, Adult Education
Types:
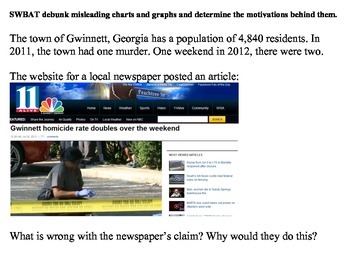
Misleading Charts and Graphs (Statistics)
Teaching students to deduce information provided in charts and graphs is an essential part of any math curriculum.
However, what do you do when the graph itself provides misleading or false information?
This lesson is a good way to get students to look critically at graphically displayed data and see through those who try to manipulate data for their own purposes.
Subjects:
Grades:
7th - 12th, Higher Education, Adult Education
Types:
6th Grade Statistics & Data 5 - Box and Whisker Plot Powerpoint Lesson
Sixth Grade Statistics 5 - Box and Whisker Plot Powerpoint Lesson is powerful when used as direct instruction in the classroom, online or individually. It teaches students all the skills necessary to make a box and whisker plot: mean, median, lower quartile Q1, upper quartile Q3, inter quartile range, range, minimum and maximum numbers. Students then are shown how to take this information and build a box and whisker plot. Finally, students are taught how to analyze the box and whisker plot th
Subjects:
Grades:
6th, Adult Education
Also included in: 6th Grade Statistics & Data Bundle - 6 Powerpoint Lessons - 402 Slides
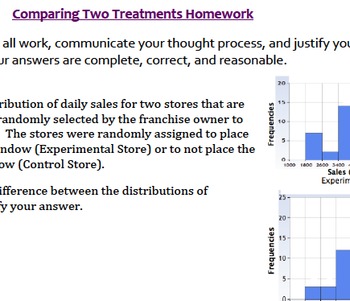
Data Analysis & Statistics Bundle (Ideal for Algebra II) Common Core High School
The problems and activities within this document are designed to assist students in achieving the following standards: S.ID.4, S.IC.1, S.IC.2, S.IC.3, S.IC.4, S.IC.5, S.IC.6, S.CP.A.2, S.CP.A.3, and S.CP.A.5, as well as the standards for mathematics practice and the literacy standards. They are also designed to help the teacher assess the students’ abilities when it comes to working with the ideas within the standards.
This folder contains the following:
- Introduction to data, statistics, and
Subjects:
Grades:
6th - 12th, Higher Education, Adult Education, Staff
Types:
O Level Statistics 4040 Lesson plans, Thematic Unit Plans Full Syllabus Latest
Unleash the Power of Statistics with Our Comprehensive Lesson Plan Bundle! Title: O Level Statistics 4040 - Complete Editable Lesson Plans BundleDiscover the world of statistics with our comprehensive lesson plan bundle. "O Level Statistics 4040 - Complete Editable Lesson Plans Bundle" equips you with a treasure trove of editable resources, ensuring a thorough understanding of statistics for both educators and students. Key Features:✨ Full Syllabus Coverage: Our bundle covers the entire O Leve
Subjects:
Grades:
6th - 12th, Adult Education, Staff
6th Grade Statistics & Data 1 - Statistical Questions & Types of Data Lesson
Sixth Grade Statistics 1 - Statistical Questions and Types of Data Powerpoint Lesson is powerful when used as direct instruction in the classroom, online, or individually. It teaches students how to recognize and pose a statistical question. Students also learn the difference between numerical and categorical data. They also learn the 4 basic steps in presenting data: posing a statistical question, gathering the data, displaying the data, and answering the question they posed. There are 22
Subjects:
Grades:
6th, Adult Education
CCSS:
Also included in: 6th Grade Statistics & Data Bundle - 6 Powerpoint Lessons - 402 Slides

IB Psychology Internal Assessment (IA) Analysis and Statistics Slides
Walk your students through the Analysis section of the Internal Assessment (IA). Google slides include content and background information on statistics, directions and links for students to follow while they write their Analysis section, create their table and graph, and run descriptive statistics and inferential statistics with their raw data. Includes links to online calculators for mean, standard deviation, Mann Whitney U Test, Wilcoxon Test. Analysis rubric and links to two IA exemplars incl
Subjects:
Grades:
9th - 11th, Higher Education, Adult Education
6th Grade Powerpoint Mega Math Bundle - 58 Lessons - 2923 Slides
Sixth Grade Powerpoint Math Bundle is composed of 58 different high quality math powerpoint lessons comprising 2,923 slides. These are perfect for distance learning on Zoom or similar formats. On top of that they are powerful when used as direct instruction in the classroom.There are 22 strategies of effective teaching based on research in these powerpoint lessons. . For further information on each lesson click on them individually. This is a growing bundle which means as new products are a
Subjects:
Grades:
6th, Adult Education

Misleading Statistics
Did you know that 90% of all serial killers are right-handed?
Well, of course... 90% of all people in general are right-handed.
This is a great activity that can be used as an introduction to any statistics class or unit. It makes students think about how people misinterpret statistics and how two people can look at the same data and draw different conclusions.
Subjects:
Grades:
7th - 12th, Higher Education, Adult Education

Statistics Module Bundle
Dear Customers!This Statistics Module Bundle file contains 18 lectures which are covered during Statistics Module.Each lecture containing:- Lecture PPT- Test Bank with answers for each lecture - Exercises for seminars/lectures with answers
Subjects:
Grades:
6th - 12th, Higher Education, Adult Education, Staff
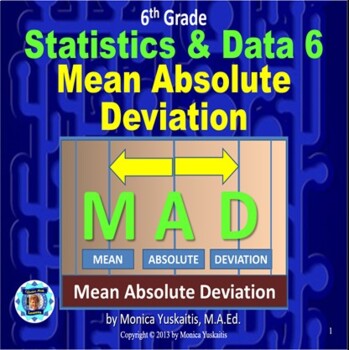
6th Grade Statistics & Data 6 - Mean Absolute Deviation Powerpoint Lesson
Sixth Grade Statistics 6 - Mean Absolute Deviation Powerpoint Lesson is powerful when used as direct instruction in the classroom, online or individually. It teaches students the steps to take to find the Mean Absolute Deviation of a set of data. The skills necessary to do this task are reviewed: how to find the mean, how to find absolute values of numbers, and how to add and subtract integers. There are 22 effective teaching strategies based on research used in this lesson. For best resul
Subjects:
Grades:
6th, Adult Education
Also included in: 6th Grade Statistics & Data Bundle - 6 Powerpoint Lessons - 402 Slides
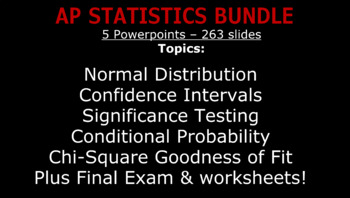
AP Statistics Bundle: Lecture/Worksheets - Hypothesis Testing, Confidence & More
This bundle includes the following presentation/lectures:- 22-slide presentation on Independence and Conditional Probability- 41-slide presentation on the Normal Distribution & Z-Scores- 55-slide presentation on the Student's T-Distribution- 96-slide presentation on Confidence Intervals & Hypothesis Testing- 49-slide presentation on Chi-Square Goodness of Fit TestingA Cumulative Final Exam with 36 questionsWorksheets on probability, sampling and box & whisker charts, measures of cent
Subjects:
Grades:
10th - 12th, Higher Education, Adult Education
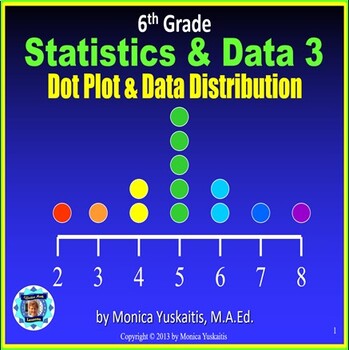
6th Grade Statistics & Data 3 - Dot Plot and Data Distribution Powerpoint Lesson
Sixth Grade Statistics 3 - Dot Plot and Data Distributions Powerpoint Lesson - is powerful when used as direct instruction in the classroom, online, or individually. It teaches students how to read and create dot plots. In addition, students learn to analyze the data as to its center, spread, and most common numbers. There are 22 strategies of effective teaching based on research. For best results, students should have white boards and dry erase markers. For instructions on how to successf
Subjects:
Grades:
6th, Adult Education
CCSS:
Also included in: 6th Grade Statistics & Data Bundle - 6 Powerpoint Lessons - 402 Slides
6th Grade Statistics & Data 4 - Histogram Powerpoint Lesson
Sixth Grade Statistics 4 - Histogram Powerpoint Lesson is powerful when used as direct instruction in the classroom, online or individually. It teaches students how to identify a histogram and how to make one. Comparisons are made between a bar graph and a histogram. Many terms are defined such as axis, scale, frequency, count, range, interval, mound, skewed left, skewed right and more. There are 22 effective teaching strategies based on research used in this lesson. For best results, stud
Subjects:
Grades:
6th, Adult Education
Types:
Also included in: 6th Grade Statistics & Data Bundle - 6 Powerpoint Lessons - 402 Slides
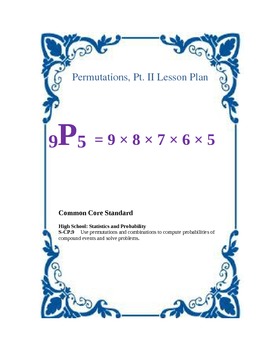
Permutations and Factorials Lesson Plans
Included on one file are two separate lesson plans. A description of each lesson follows:
Factorials & Permutations
This is a complete lesson plan that introduces factorials and "simple" permutations. Students will evaluate factorial expressions and determine the number of permutations from a number of objects.
Permutations, Pt. II
This is a complete lesson that includes more practice with permutations along with more problem solving activities.
Each lesson plan includes a warm-up activit
Subjects:
Grades:
8th - 10th, Adult Education
Types:
6th Grade Statistics & Data 2 - Mean, Median, Mode & Range Powerpoint Lesson
Sixth Grade Statistics 2 - Mean, Median, Mode and Range Powerpoint Lesson is powerful when used as direct instruction in the classroom, online, or individually. It teaches students how to find the mean, median, mode and range in a group of statistics. There are 22 effective teaching strategies based on research used in this lesson. For best results, students should have white boards and dry erase markers. For instructions on how to successfully use this powerpoint math lesson click here.
Subjects:
Grades:
6th, Adult Education
Also included in: 6th Grade Statistics & Data Bundle - 6 Powerpoint Lessons - 402 Slides
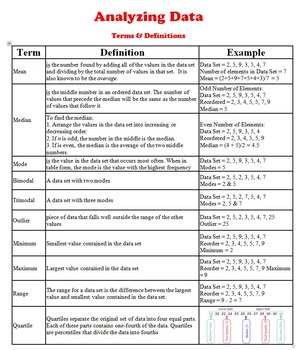
Data Analysis - Terms & Definitions (statistical measures definitions)
This Handout is part of : Maze - BUNDLE Statistical Measures (Mean, Median, Mode, & Range)
This handout is a quick reference sheet which includes the main definitions needed to introduce the data analysis terms in statistics. Terms such as: mean, median, mode, bimodal, outlier, minimum, range, quartile, box-and-whisker,.... etc. are some of the definitions shared on this handout.
Share it with your students, test them on it, and expect them to know it by heart. Those definitions are the
Subjects:
Grades:
6th - 12th, Higher Education, Adult Education
Types:

WHO'S YOUR DADDY? Corn Genetics Unit WITH Guided Inquiry Lab
50 PAGE Mendelian Genetics Unit with a Guided Inquiry Lab using an optional Chi-Squared Statistical Test.
This can be done as a lab or can just be used as a PowerPoint presentation on Genetics and/or Meiosis.
THIS LAB IS BEST USING THE REAL EARS OF CORN BUT CAN BE DONE WITH THE PHOTOS AT THE END. CORN EARS CAN BE OBTAINED FROM BIOLOGICAL SUPPLY COMPANIES OR YOUR GARDEN. :)
This lab covers the following concepts:
1. Corn Genetics, Monohybrids and Dihybrids
2. Corn (Plant) Reproduction (Ani
Subjects:
Grades:
7th - 12th, Higher Education, Adult Education
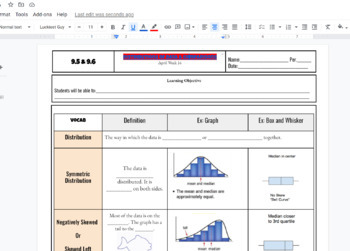
Distributions of Data Scaffolded Fillable Notes (Skewed Left & right) w/ KEY
Distributions of Data Scaffolded Fillable Notes (Skewed Left & right) Includes a problem of creating box plot, bar chart, and dot plot. KEY IS INCLUDED linked at top of title highlighted in red!!! , Algebra 1 or Math 1 class in highschool setting IEP 504 EL learners visuals for better understanding. YOU CAN EDIT THE GOOGLE DOC to your liking!!!
Subjects:
Grades:
7th - 12th, Higher Education, Adult Education
CCSS:

Unit 9: Data and Statistics Fillable Notes
Unit 9: Data and Stats(No 9.3/ Skip)9.1 Central Tendencies: Mean, Median and Mode9.2 Graphical Data: Bar Charts, Dot Plots and Histograms9.3 NONE9.4A 5 number summary and box and whisker plots 9.4B Standard Deviation9.5/9.6 Data Distributions (skewness) left or right9.7 Frequency Tables and relative frequency tablesStudents go over the vocabulary and complete the examples with the vocabulary scaffolded. Notes are scaffolded. Includes hook video hyperlinked on the "learning objective" title. Key
Subjects:
Grades:
6th - 12th, Higher Education, Adult Education
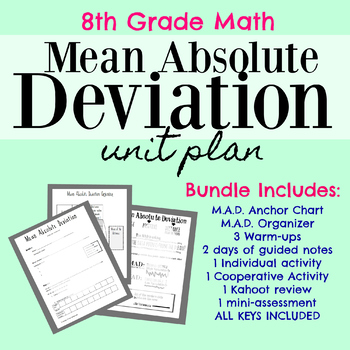
Mean Absolute Deviation Bundle
***NOW WITH DAILY TEACHER GUIDE FOR EASY IMPLEMENTATION***
This purchase also includes exclusive access to the highly rated MAD Anchor Chart!
This is the perfect unit bundle to teach Mean Absolute Deviation in a way that the students will understand and ENJOY! This unit proved very effective according to last year's STAAR scores. Included:
M.A.D. organizer to laminate or print!
3 Warm-ups
2 days of guided notes
1 individual activity
1 Cooperative Activity
1 Kahoot review
1 mini-assessment
ALL
Subjects:
Grades:
7th - 12th, Higher Education, Adult Education
Types:
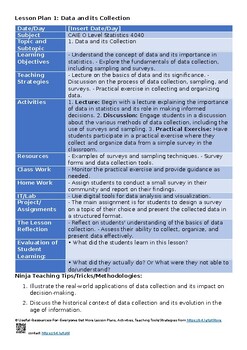
1. Data and its collection -O Level Statistics 4040Lesson Plans Unit Plans Thema
Dive into the World of Data Collection with Our Comprehensive Lesson Plans! Title: Data and its collection - O Level Statistics 4040 Lesson Plans Unit Plans Thematic Lesson Plans Explore the exciting world of data collection with our meticulously crafted lesson plans. "Data and its collection - O Level Statistics 4040 Lesson Plans Unit Plans Thematic Lesson Plans" offers an enriching learning experience for both students and teachers. Key Features:✨ Syllabus Aligned: Our lesson plans are metic
Subjects:
Grades:
5th - 12th, Adult Education, Staff
AP Statistics Lessons
This set of PowerPoint presentations includes all the lessons and homework assignments I developed to teach AP Statistics. Each lesson includes lesson goals, lecture materials, bolded key definitions, activities (including links to actual, relevant AP problems by section), and homework assignments.
You could use these lessons to teach in its entirety a year-long AP Statistics course, or a college-level Statistics 101 or even a HS-level non-AP statistics course with minor tweaking. I generally d
Subjects:
Grades:
9th - 12th, Higher Education, Adult Education
CCSS:
Showing 1-24 of 157 results


