1,249 results
10th grade statistics lessons
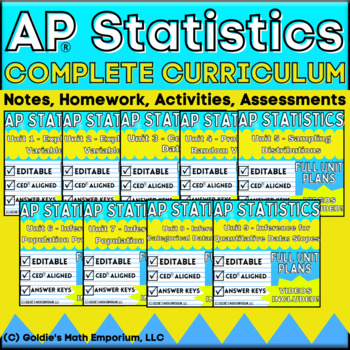
Goldie's FULL CURRICULUM for AP® Statistics
AP® Statistics Full CurriculumIn this product, you will receive all of Goldie's products related to AP® Statistics. All 9 units follow the College Board's© CED and include the following:Student Guided NotesStudent notes are "fill in the blank" style notes; teachers lead the lesson and work with students to complete the content. All content from the AP® CED is included and taught in the notes for this curriculum.Content VideosEach set of notes has a video to accompany it, where I teach the lesson
Subjects:
Grades:
10th - 12th
Types:
CCSS:
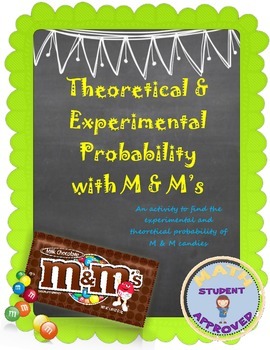
Theoretical and Experimental Probability M&M activity
Students need to find the probability of picking certain colored M&Ms, and asked to change them into decimals, fractions, and percents. They are asked to draw specific M&Ms at random for experimental probability problems. They are asked to make a few predictions, as well. This is a lengthy lesson and takes a while to get through, so make sure you have enough time to get through it. It can be done in 2 days, and if you need to use colored chips or counters instead, go for it!
Subjects:
Grades:
5th - 11th
Types:
Goldie’s AP® Statistics UNIT 1 PLANS – Exploring One Variable Data
AP® Statistics Unit 1 – Exploring One Variable DataUnit BundleThis unit contains everything you need to teach "Exploring One Variable Data" in AP® Statistics or regular-level Statistics. Students will go through how to represent quantitative and categorical data with various graphs and tables; find and interpret various measures of center and spread; and calculate and compare positions and percentiles in a normal distribution. This unit is part of my larger unit bundle: Goldie's AP® Statistics F
Subjects:
Grades:
10th - 12th
Types:
CCSS:
Also included in: Goldie's FULL CURRICULUM for AP® Statistics
Goldie’s AP® Statistics UNIT 4 PLANS – Probability and Random Variables
AP Statistics Unit 4 – Probability, Random Variables, and Probability DistributionsUnit BundleThis unit contains everything you need to teach "Probability, Random Variables, and Probability Distributions" in AP® Statistics or regular-level Statistics. Students will go through how to calculate and interpret basic probabilities, conditional probabilities, and probabilities for the union and interception of two events; represent and interpret the probabilities for discrete and continuous random var
Subjects:
Grades:
10th - 12th
CCSS:
Also included in: Goldie's FULL CURRICULUM for AP® Statistics
Goldie’s AP® Statistics UNIT 5 PLANS – Sampling Distributions
AP® Statistics Unit 5 – Sampling DistributionsUnit BundleThis unit contains everything you need to teach "Sampling Distributions" in AP® Statistics or regular-level Statistics. Students will go through how to calculate probabilities involving the normal probability distribution; calculate and interpret parameters, check appropriate conditions, and calculate and interpret probabilities of a sampling distribution for sample proportions (and a difference in sample proportions); and calculate and in
Subjects:
Grades:
10th - 12th
Types:
CCSS:
Also included in: Goldie's FULL CURRICULUM for AP® Statistics
AP Statistics Notes Curriculum ENTIRE YEAR Units 1-9 Notes with Keys
121 PAGES of AP Statistics Notes to teach through ALL 9 UNITS over the ENTIRE YEAR in your AP Stats class! Histograms, box plots, scatterplots, linear models, residual plots, linear regression computer output, sampling methods, bias, experiment design, probability rules, random variables, binomial distributions, sampling distributions of proportions and means, chi-square distribution, confidence intervals, hypothesis tests, TI-84 Plus CE calculator functions, and so much more! Aligns with the AP
Subjects:
Grades:
10th - 12th
Elementary Statistics Complete Curriculum
VIEW FULL PREVIEW VIDEO HERE: https://youtu.be/eRPmKXVrmw4*Video Note: This video was made before changing to the bundle format, so the setup is a little different. Each section is an individual zipped file instead of being organized into folders. Quizzes and other extras can be found in the Bonus Content folder.Elementary Statistics Complete Curriculum (One Semester)This bundle includes everything in my Elementary Statistics Curriculum.The Complete Curriculum Includes:-Lessons with Lecture Note
Subjects:
Grades:
10th - 12th, Higher Education
Types:
AP Statistics Curriculum Mega Bundle (with videos of each lesson)
This Bundle contains everything you will need to prepare your students for success on the AP® exam.I have designed these lessons over the past 12 years teaching AP Statistics. The organization and rigor of the lessons and practice have produced an AP pass rate well over the national average.I am redesigning the notes to make improvements including power point slides and keynote to present lessons. The upgrades will be free to those who have purchased this bundle. The curriculum was redesigned i
Subjects:
Grades:
9th - 12th, Higher Education
Types:
Goldie’s AP® Statistics UNIT 6 PLANS – Inference for Proportions
AP® Statistics Unit 6 – Inference for Categorical Data: ProportionsUnit BundleThis unit contains everything you need to teach "Inference for Categorical Data: Proportions" in AP® Statistics or regular-level Statistics. Students will go through how to justify conditions, calculate, interpret, and justify a claim about a confidence interval for a population proportion; identify the relationships between sample size, the width of a confidence interval, confidence level, and margin of error for a po
Subjects:
Grades:
10th - 12th
Types:
CCSS:
Also included in: Goldie's FULL CURRICULUM for AP® Statistics
Goldie’s AP® Statistics UNIT 3 PLANS – Collecting Data
AP® Statistics Unit 3 – Collecting DataUnit BundleThis unit contains everything you need to teach "Collecting Data" in AP® Statistics or regular-level Statistics. Students will go through how to identify types of studies, sampling methods, and sources of bias in a study; compare and interpret the components of a well-designed experiment; and explain why a particular experimental design is appropriate. This unit is part of my larger unit bundle: Goldie's AP® Statistics Full Curriculum This produc
Subjects:
Grades:
10th - 12th
Types:
CCSS:
Also included in: Goldie's FULL CURRICULUM for AP® Statistics
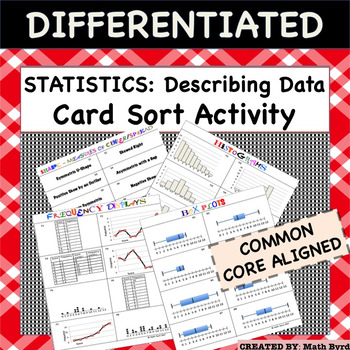
Statistics:Representing & Interpreting Data (Histogram, Box Plot, Dot Plot)
Complete Lesson! This lesson features a 40 CARD SORT, Differentiated Cornell Notes, Distribution Shapes Graphic Organizer, and Power Point to go with the notes! Perfect for the inclusive classroom! Within the Card Sort Activity there are 5 categories of cards to match: 1) Histogram2) Frequency Display (including Dot Plots, Frequency Line Graphs and Tables)3) Box Plots4) Describing Shape5) Describing Measures of Center & Spread. With 8 different sets of matches, there are 40 cards total. Stud
Subjects:
Grades:
8th - 12th
Types:
CCSS:
Also included in: Common Core Algebra 1 CARD SORT ACTIVITIES - BUNDLE PRICE!
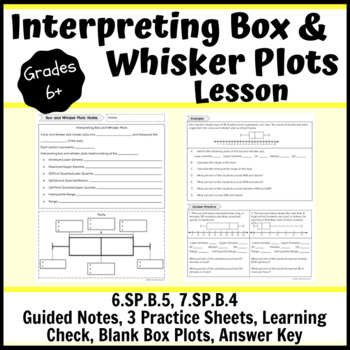
Interpreting Box and Whisker Plots Lesson- Notes, Practice, Learning Check
This interpreting box and whisker plots lesson consists of a guided notes sheet, 3 practice sheets, a learning check, 2 different half sheets of blank box plots and an answer key. You can hole punch the note pages and have students place them in their binders or a 3-prong folder. There are teacher notes to guide you through the direct instruction with students. There are three pages of practice. One page can be used as independent practice when students are ready; this could be in class or homew
Subjects:
Grades:
6th - 10th
Types:
Goldie’s AP® Statistics UNIT 7 PLANS – Inference for Quantitative Data: Means
AP Statistics Unit 7 – Inference for Quantitative Data: MeansUnit BundleThis unit contains everything you need to teach "Inference for Quantitative Data: Means" in AP® Statistics or regular-level Statistics. Students will go through how to describe t-distributions and their properties; calculate, interpret, and justify a claim about a confidence interval for a population mean; identify the null and alternative hypotheses for a population mean and identify an appropriate testing method for a popu
Subjects:
Grades:
10th - 12th
Types:
CCSS:
Also included in: Goldie's FULL CURRICULUM for AP® Statistics
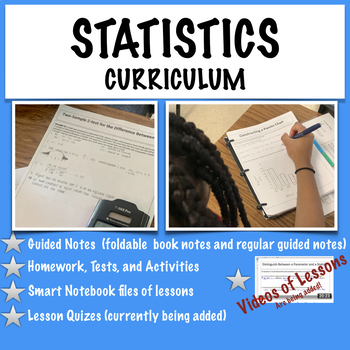
Statistics-Whole Curriculum (with videos of lessons)
This bundle will contain a whole curriculum for a introductory statistics course. The lessons are suitable for a college introductory course or a full year high school introductory statistics course.The bundle contains the following lessons: Unit 1: -Lesson 1: Introduction to Statistics -Lesson 2: Classifying Data -Lesson 3:Experimental Design Assignments/Activity/Quizzes for each lesson Pacing guide Test Unit 2: -Lesson 4:Frequency D
Subjects:
Grades:
9th - 12th, Higher Education
Types:
Goldie’s AP® Statistics UNIT 8 PLANS – Inference for Categorical Data Chi-Square
AP® Statistics Unit 8 – Inference for Categorical Data: Chi-SquareUnit BundleThis unit contains everything you need to teach "Inference for Categorical Data: Chi-Square" in AP® Statistics or regular-level Statistics. Students will go through how to set up hypotheses, check conditions, calculate the chi-square test statistic, interpret the p-value, and justify a claim using the Chi-Square Goodness of Fit Test, the Chi-Square Test for Homogeneity, and the Chi-Square Test for Association/Independen
Subjects:
Grades:
10th - 12th
Also included in: Goldie's FULL CURRICULUM for AP® Statistics
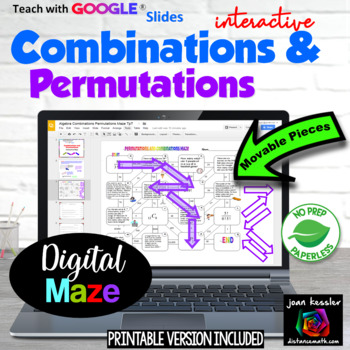
Permutations and Combinations Digital Maze + HW and Printable version
This Combinations, Permutations, and Counting Fun Maze is NO PREP for you and engaging,challenging, and fun for your students. This resource included both a digital and printable version. This activity reinforces the concepts of permutations, combinations, and counting principles and is great practice. The different types of problems are placed randomly in the maze so that students must first decide the type of question before solving. The questions on the maze are letter coded so that if a s
Subjects:
Grades:
8th - 11th
Types:
CCSS:
Also included in: Algebra 2 Digital MEGA Bundle plus Printables
High School Data Analysis Project
This project covers a large range of data analysis methods. There are eleven total parts to the project.
Part One: the students have to collect data from 20 students outside of the classroom. Directions specify to ask students from each grade level.
Part Two: Measures of Center and Variation. Students will calculate mean, median, mode, range, and standard deviation for some of the data collected. Definitions of each term are included.
Part Three: Box-And-Whisker Plot. Students will create t
Subjects:
Grades:
9th - 12th
Types:
CCSS:
Statistics: The Normal Distribution
StatisticsUnit 2: The Normal Distribution Complete Unit Bundle Welcome! This is the complete unit plan for the second unit in my regular level Statistics class. (If you are interested in the AP Statistics Unit 1 Plans, check out my listing here.) Included in this resource: 6 complete sets of student-guided notes (annotated answer keys included)7 homework problem sets + complete test review (annotated answer keys included)2 assessments – quiz and test (answer keys included)2 in-class review Power
Subjects:
Grades:
10th - 12th
Types:
CCSS:
Also included in: Statistics: FULL CURRICULUM BUNDLE
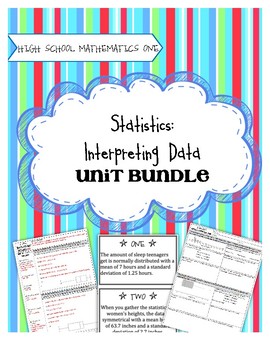
High School Math 1: Statistics and Interpreting Data
Task-Based Learning gets students intrinsically motivated to learn math! No longer do you need to do a song and dance to get kids interested and excited about learning. The tasks included in this unit, followed by solidifying notes and practice activities, will guarantee that students understand the concepts. This unit covers:
- Displaying one-variable data in a histogram, dot plot, or box plot
- Describing the distribution of data using statistical vocabulary
- Using data models and stati
Subjects:
Grades:
8th - 10th
Types:
CCSS:
Goldie’s AP® Statistics UNIT 9 PLANS – Inference for Quantitative Data: Slopes
AP Statistics Unit 9 – Inference for Quantitative Data: SlopesUnit BundleThis unit contains everything you need to teach "Inference for Quantitative Data: Slopes" in AP® Statistics or regular-level Statistics. Students will go through how to identify an appropriate confidence interval procedure, verify the conditions, calculate and interpret the interval for a slope of a regression model; and identify the null and alternative hypotheses, verify the conditions for making statistical inferences, c
Subjects:
Grades:
10th - 12th
Types:
Also included in: Goldie's FULL CURRICULUM for AP® Statistics
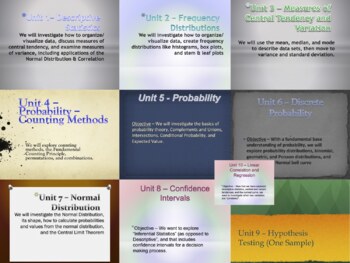
A Mountain of Statistics Curriculum - One Full Year Bundle
This is a bundle of 10 Units, Midterm Exam, & Final Exam designed for a high school Statistics Class (can be applied to University discipline). Each unit plan includes Common Core Standards, Key Concepts/Enduring Understandings, Essential Questions/Do Now, Activities, Resources, Procedures, and Assessment techniques. It is designed to be a lifelong tool that you can add to, edit, and re-use every year! Please see each Unit Statistics Product in the MountainWorks Store (sold separately) for
Subjects:
Grades:
9th - 12th, Higher Education
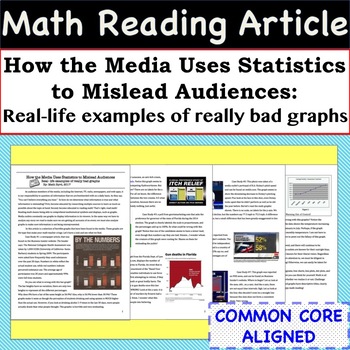
Statistics Math Article - Case Studies of Bad Graphs found in the Media
Incorporate Reading & Writing into the Math Classroom with this article and accompanying worksheet! The 4 page article is entitled - "How the Media Uses Statistics to Mislead Audiences: Real- life examples of really bad graphs". The worksheet helps students summarize the case studies and the article as a whole. This resource can be used in so many ways, some ideas are: station activity, independent reading assignment, small group activity, homework assignment, or whole class discussion.Skill
Subjects:
Grades:
8th - 11th
CCSS:
Also included in: Common Core Algebra 1 MATH READING ARTICLES - BUNDLE PRICE!
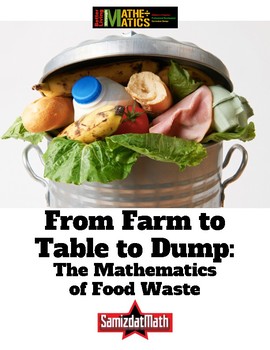
Food Waste and Mathematics: From Farm to Table to Dump
Here's a very uncomfortable fact: it takes 4 pounds of potatoes to make 1 pound of potato chips. That means that for every 1 pound bag of potato chips you eat, 3 pounds of potatoes have to be thrown away. What a waste of food! This is a series of activities that looks at the hidden world of food waste. It includes a look at how much food is wasted as it is "processed" into finished products like french fries and potato chips. It also includes mathematical activities where students calculate how
Subjects:
Grades:
5th - 12th, Adult Education
Types:
High School Math 1: ENTIRE YEAR BUNDLE!
This is a $144 dollar value!
This bundle includes absolutely everything you need to teach the entire High School Math 1 year-long 9th grade course. There are 10 full units included in this bundle purchase, including all developing tasks, solidifying notes, practice activities, and assessments. These are the units included in this purchase:
Unit 1: Geometry and Rigid Transformations
Unit 2: Statistics and Interpreting Data
Unit 3: Expressions and Equations
Unit 4: Compound Inequalities and Abso
Subjects:
Grades:
8th - 10th
Types:
CCSS:
Showing 1-24 of 1,249 results


