408 results
High school statistics lessons $5-10
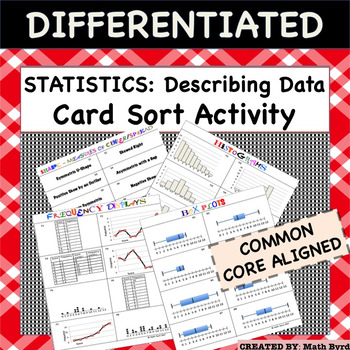
Statistics:Representing & Interpreting Data (Histogram, Box Plot, Dot Plot)
Complete Lesson! This lesson features a 40 CARD SORT, Differentiated Cornell Notes, Distribution Shapes Graphic Organizer, and Power Point to go with the notes! Perfect for the inclusive classroom! Within the Card Sort Activity there are 5 categories of cards to match: 1) Histogram2) Frequency Display (including Dot Plots, Frequency Line Graphs and Tables)3) Box Plots4) Describing Shape5) Describing Measures of Center & Spread. With 8 different sets of matches, there are 40 cards total. Stud
Subjects:
Grades:
8th - 12th
Types:
CCSS:
Also included in: Common Core Algebra 1 CARD SORT ACTIVITIES - BUNDLE PRICE!
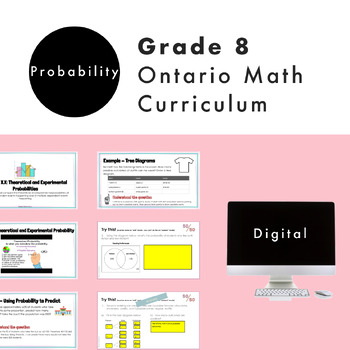
Grade 8 Ontario Math Probability Digital Google Slides + Form
Do you need a practical and engaging resource for the NEW Ontario Math Number strand? Are you planning for the NEW Grade 8 Ontario Math Curriculum? This editable Google Slide resource is what you need! This resource is for the Grade 8 DATA strand and covers specific expectations for “D2 Probability". In this resource, students will experience math through engaging real-life questions, storytelling through math, and interactive slides. What’s Included2 Google Slide presentations67 UNIQUE and ED
Subjects:
Grades:
7th - 9th
Types:
Also included in: Grade 8 NEW Ontario Math Curriculum Full Year Digital Slides Bundle
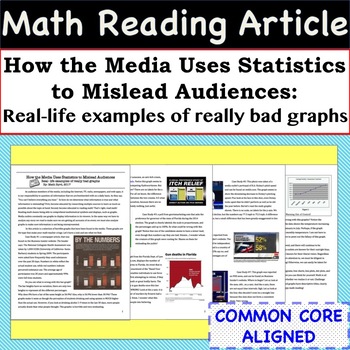
Statistics Math Article - Case Studies of Bad Graphs found in the Media
Incorporate Reading & Writing into the Math Classroom with this article and accompanying worksheet! The 4 page article is entitled - "How the Media Uses Statistics to Mislead Audiences: Real- life examples of really bad graphs". The worksheet helps students summarize the case studies and the article as a whole. This resource can be used in so many ways, some ideas are: station activity, independent reading assignment, small group activity, homework assignment, or whole class discussion.Skill
Subjects:
Grades:
8th - 11th
CCSS:
Also included in: Common Core Algebra 1 MATH READING ARTICLES - BUNDLE PRICE!
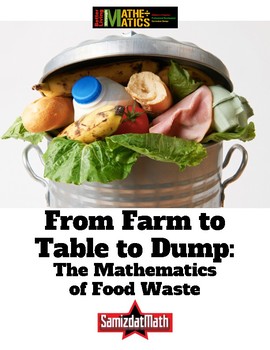
Food Waste and Mathematics: From Farm to Table to Dump
Here's a very uncomfortable fact: it takes 4 pounds of potatoes to make 1 pound of potato chips. That means that for every 1 pound bag of potato chips you eat, 3 pounds of potatoes have to be thrown away. What a waste of food! This is a series of activities that looks at the hidden world of food waste. It includes a look at how much food is wasted as it is "processed" into finished products like french fries and potato chips. It also includes mathematical activities where students calculate how
Subjects:
Grades:
5th - 12th, Adult Education
Types:
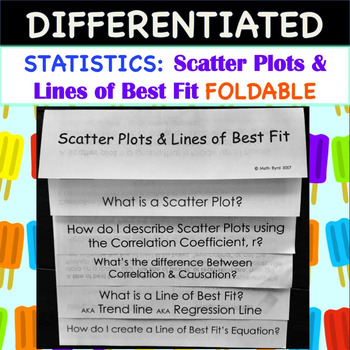
Statistics:Scatter Plots and Lines of Best Fit FOLDABLE
So Easy to Use! Simply print and fold! No need to rotate pages! Scatter Plots and Lines of Best Fit FOLDABLE also includes a PowerPoint to go along with the foldable.Foldable has 2 tiers of differentiation, perfect for the inclusive classroom! 1 set has fill-in-the-blank style notes within the foldable, while the other foldable has the notes already filled in. On both sets, students will have to work out the examples.Students will learn how to: Create Scatter PlotsDescribe Scatter Plots using Co
Subjects:
Grades:
8th - 11th
CCSS:
Also included in: Common Core Algebra 1: STATISTICS UNIT - BUNDLE PRICE!
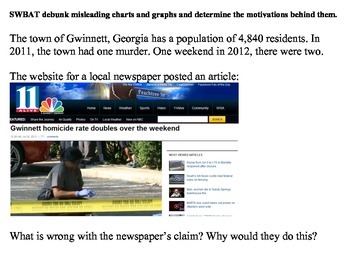
Misleading Charts and Graphs (Statistics)
Teaching students to deduce information provided in charts and graphs is an essential part of any math curriculum.
However, what do you do when the graph itself provides misleading or false information?
This lesson is a good way to get students to look critically at graphically displayed data and see through those who try to manipulate data for their own purposes.
Subjects:
Grades:
7th - 12th, Higher Education, Adult Education
Types:
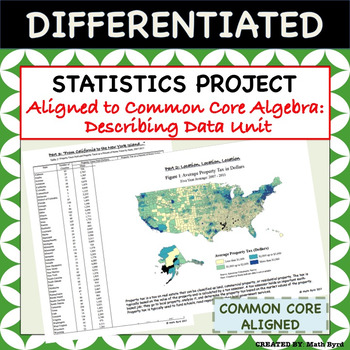
Statistics Project - Aligned to Common Core Algebra - Describing Data Unit
This differentiated U.S. Home Energy & Tax Themed Statistics Project covers all of the "describing data" standards of the Common Core Algebra Course using real data! Students will analyze various forms of tables & graphics to make inferences and interpret the data. The project is perfect for use as a summative assessment since students are required to justify their findings in open-ended format. Allow students to work in pairs, small groups, or individually! A grading rubric and selected
Subjects:
Grades:
8th - 11th
Types:
CCSS:
Also included in: Common Core Algebra 1 PROJECTS - BUNDLE PRICE!
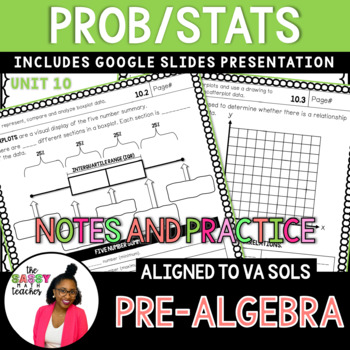
8th Grade Statistics and Probability Notes - 2016 Va Math SOLs
This 8th Grade Statistics and Probability Notes bundle is a great way to introduce your students to compound probability, boxplots and scatterplots.⭐️⭐️Full Year of 8th Grade Math Guided Notes⭐️⭐️⭐️⭐️⭐️FREE 8th Grade Math Pacing Guide⭐️⭐️⭐️Your 8th-graders will learn to distinguish between independent and dependent events along with interpreting and creating boxplots and scatterplots.The notes are perfect for binders!PLUS: At the top of each page, you will find the learning objective and space f
Subjects:
Grades:
7th - 9th
Types:
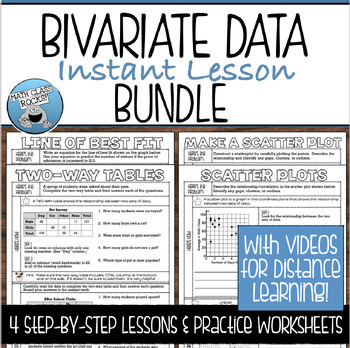
BIVARIATE DATA GUIDED NOTES AND PRACTICE BUNDLE
Save time and make your life easy with this set of BIVARIATE DATA GUIDED NOTES and PRACTICE WORKSHEETS! Perfect for introducing a new concept, reviewing a previously learned skill, or your interactive notebook! These guided notes will simplify every lesson with step-by-step examples and practice problems to provide a year-long resource for your students to refer to again and again!This lesson is included in my Linear Equations Instant Lesson BUNDLE. Click HERE to view this resource and SAVE 25%!
Subjects:
Grades:
7th - 9th
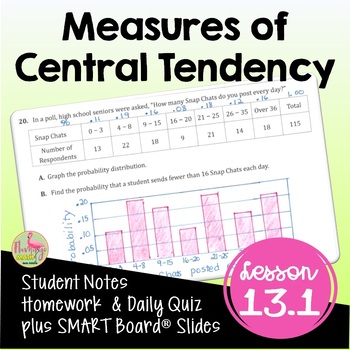
Measures of Central Tendency (Algebra 2 - Unit 13)
Measures of Central Tendency Algebra 2 Lesson:Your Pre-AP Algebra 2 Honors students will draw, analyze and interpret box-and-whisker plots, find outliers, and calculate measures of central tendency in this unit 13 lesson on Data Analysis & Statistics that cover the concepts in depth. #distancelearningtptWhat is included in this resource?⭐ Guided Student Notes⭐ Google Slides®⭐ Fully-editable SMART Board® Slides⭐ Homework/Practice assignment⭐ Lesson Warm-Up (or exit ticket)⭐Daily Content Quiz
Subjects:
Grades:
8th - 11th, Higher Education
CCSS:
Also included in: Algebra 2 Curriculum Mega Bundle | Flamingo Math
Mean, Median, Mode & Range Lesson | Printable & Digital
About this Product• This download includes resources needed for one 45-minute science lesson. No prep needed!• The resources in this download are re-bundled from my Lab Practices Mini Unit Bundle.• Purchase materials for the topic(s) pertinent to your classroom - not an entire unit!• Files in this download are optimized for use with Adobe and Microsoft Office Products.Important Notes• Download a FREE Lesson to learn more about the resources included HERE.• Save 50% with the Nature of Science Bu
Subjects:
Grades:
6th - 10th
Types:
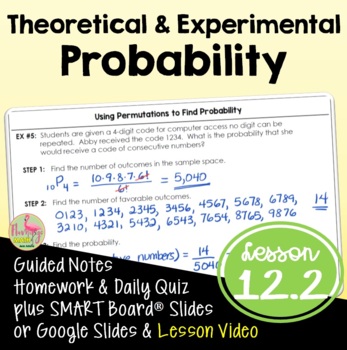
Theoretical and Experimental Probability (Algebra 2 - Unit 12)
Theoretical & Experimental Probability Algebra 2 Lesson:Your Pre-AP Algebra 2 Honors students will find both experimental and theoretical probabilities in this Unit 12 lesson. #distancelearningtptWhat is included in this resource?⭐ Guided Student Notes⭐ Google Slides®⭐ Fully-editable SMART Board® Slides⭐ Homework/Practice assignment⭐ Lesson Warm-Up (or exit ticket)⭐ Daily Content Quiz (homework check)⭐ Video Lesson Link for Distance Learning - Flipped Classroom models⭐ Full solution setStude
Subjects:
Grades:
8th - 11th, Higher Education
CCSS:
Also included in: Algebra 2 Curriculum Mega Bundle | Flamingo Math
Multiplication Rules and Conditional Probability (Lesson with Homework)
Elementary Statistics - Multiplication Rules and Conditional ProbabilityCommon Core Aligned Lesson Plan HomeworkThis lesson plan includes:-Lecture Notes (PDF, PowerPoint, and SMART Notebook)-Blank Lecture Notes (PDF and SMART Notebook)-Homework (PDF and Word)-Answer Key (PDF)-Conditional Probability Demonstration Handout (PDF and Word)You do not need to have PowerPoint or SMART Notebook to receive the full benefits of this product. There are also PDF versions included!Lesson Objectives:-Find the
Subjects:
Grades:
10th - 12th, Higher Education
CCSS:
Also included in: Probability and Counting Rules Lesson Plan Bundle
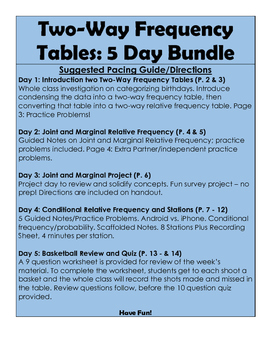
Two-Way Frequency Tables BUNDLE: 5 days - no prep!
This 5 day bundle introduces two way frequency tables, joint and marginal relative frequency, as well as conditional relative frequency. Guided notes, practice problems, and a project is included. The notes are scaffolded and the practice problems help students to solidify the concepts. Stations and a review activity is also provided, as well as a 10 question quiz. A pacing guide is given, but you may also reorganize the lessons if you please. This thorough 5-day bundle helps students to access
Subjects:
Grades:
8th - 9th
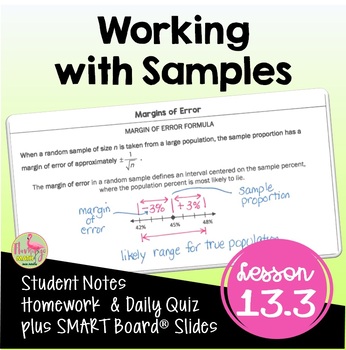
Working with Samples (Algebra 2 - Unit 13)
Working with Samples Algebra 2 Lesson:Your Pre-AP Algebra 2 Honors students will find draw, analyze and interpret box-and-whisker plots, find outliers, and calculate measures of central tendency in this unit 13 lesson on Data Analysis & Statistics that cover the concepts in depth. #distancelearningtptWhat is included in this resource?⭐ Guided Student Notes⭐ Google Slides®⭐ Fully-editable SMART Board® Slides⭐ Homework/Practice assignment⭐ Lesson Warm-Up (or exit ticket)⭐Daily Content Quiz (ho
Subjects:
Grades:
8th - 11th, Higher Education
CCSS:
Also included in: Algebra 2 Curriculum Mega Bundle | Flamingo Math
Measures of Variation and Box Plot Bundle
This bundle contains the following notes pages/activities:
--Measures of Central Tendency and IQR Notes
--Measures of Cental Tendency and IQR Practice/Homework
--Measures of Variation Guided Practice (Day 2)
--Creating a Box Plot Notes
--Creating and Interpreting Box Plot Practice/Homework
All answer keys are provided!
This is aligned to the CCSS 6.SP.3&4 and the high school statistics strand and TEKS 8.12C. This could be used in middle school or as a refresher in high school.
*********
Subjects:
Grades:
7th - 12th
Types:
Addition Rules for Probability (Lesson with Homework)
Elementary Statistics - Addition Rules for ProbabilityCommon Core Aligned Lesson with HomeworkThis lesson plan includes:-Lecture Notes (PDF, PowerPoint, and SMART Notebook)-Blank Lecture Notes (PDF and SMART Notebook)-Homework (PDF and Word)-Answer Key (PDF)You do not need to have PowerPoint or SMART Notebook to receive the full benefits of this product. There are also PDF versions included!Lesson Objectives:-Determine if events are mutually exclusive.-Find the probability of compound events, us
Subjects:
Grades:
10th - 12th, Higher Education
CCSS:
Also included in: Probability and Counting Rules Lesson Plan Bundle
Statistics:Measures of Center & Spread (Mean,Median,Mean Absolute Deviation,IQR)
Complete lesson! Differentiated Task Cards also includes: Differentiated Cornell Notes, Power Point (to go with the notes), and Practice Worksheet. Task Cards test students skills of calculating statistics, as well as probing for conceptual understanding.Skills: Students will learn mean, median, mode, range, interquartile range, mean absolute deviation, and outlier. Then students will apply conceptual understanding.Differentiation: The activity is tiered into 2 levels of difficulty. Perfect for
Subjects:
Grades:
8th - 11th
Also included in: Common Core Algebra 1 TASK CARDS - BUNDLE PRICE!
AP Statistics - Sampling Distributions- An Introduction
This is the tenth lesson in the Probability Unit for AP Statistics and the first lesson in a series of three lesson covering sampling distributions.Students will: -Determine if a number is a parameter or a statistic -Create a sampling distribution that represents all possible samples of the same size -Distinguish between a population distribution, distribution of sample data, and a sampling distribution -Determine if a statistic is an unbiased estimator -Explore the aff
Subjects:
Grades:
9th - 12th, Higher Education
Also included in: AP Statistics-Chapter 7 Bundle: Sampling Distributions
Unit 6: Introduction to Inferential Statistics and Confidence Intervals
This bundle is a great way to ease students into inferential statistics. It includes 4 lessons, review and tests.
Subjects:
Grades:
9th - 12th
Types:
Data Analysis & Statistics Bundle (Ideal for Algebra II) Common Core High School
The problems and activities within this document are designed to assist students in achieving the following standards: S.ID.4, S.IC.1, S.IC.2, S.IC.3, S.IC.4, S.IC.5, S.IC.6, S.CP.A.2, S.CP.A.3, and S.CP.A.5, as well as the standards for mathematics practice and the literacy standards. They are also designed to help the teacher assess the students’ abilities when it comes to working with the ideas within the standards.
This folder contains the following:
- Introduction to data, statistics, and
Subjects:
Grades:
6th - 12th, Higher Education, Adult Education, Staff
Types:
Alberta Math Grade 8 Unit 7 Data Analysis and Probability BUNDLE.
Bundle DescriptionAlberta Math Grade 8 Unit 7 Data Analysis and Probability BUNDLE.Unit Bundles contain all the files in both Microsoft Word and PDF Formats.Just been handed a math course and you have no idea where to begin?Relax, this program is just for you. Here you will find the basics to get you started and take the weight off your shoulders. Designed with the beginning teacher in mind, but a great time-saver for anyone, these lessons are a complete cookbook for your class. Matching lesson
Subjects:
Grades:
7th - 9th
Types:
INTRO to Probability & Expected Value - LESSONS, WORKSHEETS, PACKETS, KEYS
➤ LESSON 1: Intro to probability full 2 to 3-day GUIDED-NOTES lesson packet, 40 total exercises (can be used as classwork and/or homework), notes and step-by-step answer keys. What is the Fundamental Counting Principle? Definition and connection to Sample Space and Tree Diagrams. What is permutation vs. combination, and when do we use them? Students learn what a factorial is through flawless connections to fundamental counting principle and permutations, and how to simplify factorials without us
Subjects:
Grades:
9th - 12th, Higher Education
Types:
CCSS:
Statistics & Sampling - Complete Unit of Work
In this unit, students will learn how to conduct statistical investigations, including specifying a problem, deciding on types of data to collect and methods of data collection, understand sampling from populations and the need for samples to be representative and learn ways to ensure the investigations are not biased.
ABOUT THIS RESOURCE PACK:
This pack is designed to provide teachers with complete lesson plans and classroom resources to teach excellent lessons. It is designed to both teach t
Subjects:
Grades:
6th - 9th
Also included in: Complete Bundle - All units of work
Showing 1-24 of 408 results


