212 results
Free high school statistics lessons
Statistics:Scatter Plots and Lines of Best Fit MYSTERY ACTIVITY
In this fun activity students will solve the mystery of the stolen art by collecting data on classmate's standing long jump and height. Students will create a scatter plot and line of best fit for their data; then use their data to make predictions for the 5 suspects. Students will create a one page investigate report to discuss their procedure of investigation, their conclusion, and the strength of their conclusion by interpreting the correlation coefficient. Skills Used:Measure using RulersCon
Subjects:
Grades:
8th - 11th
Types:
CCSS:
Also included in: Common Core Algebra 1: STATISTICS UNIT - BUNDLE PRICE!
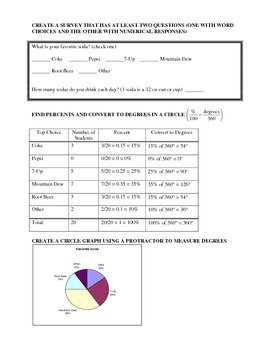
Construct a Survey Lesson/Project Plan
This PDF document consists of three parts: a lesson plan, project instructions, and a grading rubric. The lesson has students construct a survey that will have at least two questions: one that is multiple choice and one that has a numerical answer. It can either be an individual assignment or a group assignment and takes 2-3 days. I used this towards the end of the year as a review exercise since it covers multiple concepts: percents, circle graphs, central tendency (with outliers), box-and-whis
Subjects:
Grades:
6th - 9th
Types:
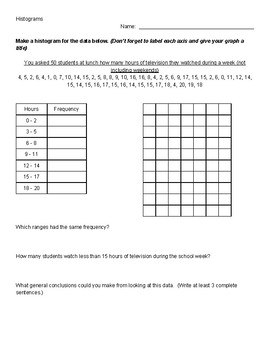
Histograms
Students will practice making histograms and manipulating bin width to see the change in frequency.
Subjects:
Grades:
6th - 9th
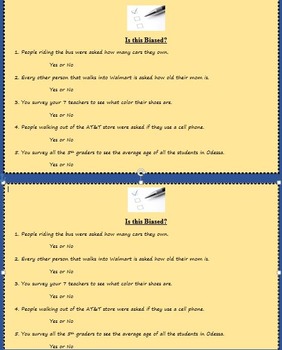
Is this Biased? (populations and random samples)
This is a 5 question quiz, exit ticket, do now, or homework assignment that reviews how surveys and samples can be biased sometimes. All 5 can be answered with a yes or no for whether it is indeed a biased survey. Enjoy and please rate and/or comment on this product!
Subjects:
Grades:
5th - 9th
Types:
Probability Addition Rules Guided Notes (Mutually Exclusive and Overlapping)
Probability Addition Rules Guided Notes
This set of guided notes focuses on finding the probability mutually exclusive and overlapping events. All of the problems feature the key word "OR." For example, students might have to find the probability of choosing an ace or a spade from a standard deck of cards.
These fill in the blank notes include 3 examples and 5 practice problems. I have included the full size notes as well as the notes printed 2 to a page, which fits well in a spiral notebook
Subjects:
Grades:
6th - 12th
CCSS:
Data Analysis Activity - Mean, Median, Mode and Range
An engaging student-led activity whereby the students will collect the measurements of other student's hand spans and then analyze this data.
Student will find mean, median, mode and range and then graph the data using a bar graph, histogram, line graph, etc.
If you download this activity, please rate it and leave comments. Thank you! :)
Subjects:
Grades:
7th - 9th
Types:
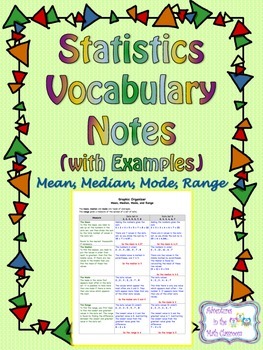
Statistics Vocabulary Notes - Mean, Median, Mode, Range
These color-coded vocabulary notes help students find the mean, median, mode, and range of a data set through example. There are two sets of data that are used to show students the different possible outcomes when it comes to finding the mean, median, mode, and range of a data set.
Subjects:
Grades:
4th - 9th
Types:
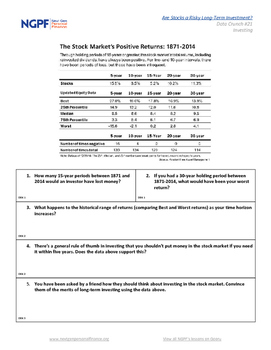
Are Stocks A Risky Long Term Investment?
Using research from WisdomTree Asset Management, students analyze the returns in from the stock market over the long term. NGPF Data Crunches ( cli.re/ngpf-data-crunch ) teach your students key personal finance concepts while also honing their analytical skills.
Grades:
7th - 12th
Types:
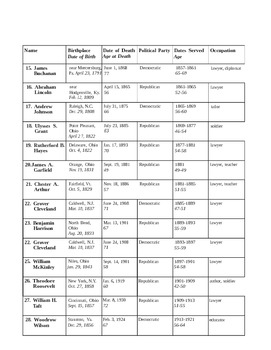
I Do Solemnly Swear...(Statistics Project)
This is a statistics project that can be modified to fit grades 6 to 12. This can also be done by hand or in excel. It would be a great assignment to use as a unit project or as a group presentation. It is a cross curriculum activity that will combine history and math together to give the kids a great way to explore box and whisker plots, bar graphs, pie charts, and more. Because this is statistics, you can change the way the graphs are created to fit the need of the course you are teaching!
Subjects:
Grades:
6th - 12th
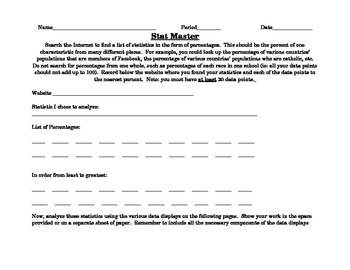
Stat Master- Statistics Analysis and Data Displays
This web-based performance task allows students to find statistics on the internet and the analyze and display the statistics using various displays. Finally, students are prompted to write about their analysis, explaining when specific displays are used and justifying their choice of a given display.
The data analysis and displays included are:
-Measures of Central Tendency (mean, median, mode)
-Measures of Variation (extremes, quartiles, or five-point summary)
-Box-and-Whisker Plot (or Box p
Subjects:
Grades:
5th - 9th
Types:
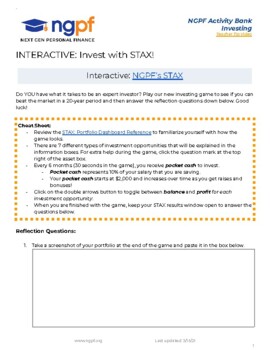
INTERACTIVE: Invest With Stax (Stock Market Arcade Game)
In this activity, students will:Make over 40 investment decisions as they allocate their savings between a multitude of investment optionsReceive short in-game lessons explaining the details of the specific investmentPractice diversifying their portfolio to yield the highest return
Subjects:
Grades:
7th - 12th
Types:

Creating Histograms, Box Plots, & Dot Plots - Lesson Plan with Activities!
*** This file is FREE because educators never get paid enough. If you find this file helpful, please consider donating no more than $1.00 via Zelle or PayPal (as Friend/Family) to InfiniteInsightHub@gmail.com. ***Teacher-created lessons and activities on creating & analyzing Histograms, Box Plots, & Dot Plots!
Subjects:
Grades:
7th - 12th, Higher Education, Adult Education, Staff
Types:
Introduction to Probability Distributions (Lesson with Homework)
Elementary Statistics - Introduction to Probability DistributionsCommon Core Aligned Lesson with HomeworkThis lesson plan includes:-Lecture Notes (PDF, PowerPoint, and SMART Notebook)-Blank Lecture Notes (PDF and SMART Notebook)-Homework (PDF and Word)-Answer Key (PDF)You do not need to have PowerPoint or SMART Notebook to receive the full benefits of this product. There are also PDF versions included!Lesson Objectives:-Determine if a variable is discrete or continuous.-Construct a probability d
Subjects:
Grades:
10th - 12th, Higher Education
CCSS:
Also included in: Distributions of Data Lesson Plan Bundle

Measures of Central Tendency PowerPoint
Here lies a PowerPoint for a quick review of how to choose the most beneficial measure of central tendency and how to calculate a "wanted" or "missing" piece of data when using mean. This makes a good math center, bellwork, or whole class discussion. Sometimes I use it to pre-test; sometimes for a post-test. ENJOY!
Subjects:
Grades:
7th - 9th
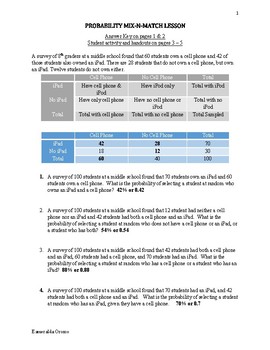
Conditional Probability Mix-n-Match Lesson
This lesson gives students the opportunity to first match four different conditional probability scenarios to their corresponding formula with the help of Venn diagrams into a graphic organizer. Then they complete a two-way table and use their graphic organizer to solve the problems.
Subjects:
Grades:
9th - 12th
Types:
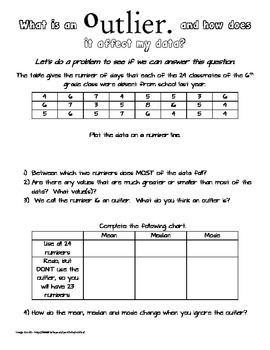
Outlier Investigation
This activity helps students investigate what an outlier is and how it affects data.
Subjects:
Grades:
4th - 9th
Types:
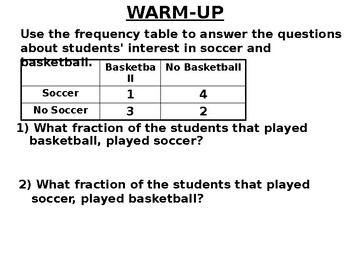
Math 8 19.6 Find the Relative Frequencies of the Data
This editable lesson was written by Alex Benn using the concepts described in his book Tenacious-Teaching: Uniting Our Superpowers to Save Our Classrooms and his website: Tenacious-Teaching.com. It includes an introductory warm-up designed to remediate the required prerequisite knowledge; concise notes; tasks that require escalating effort; numerous examples to prevent misconceptions; and in-class practice problems to promote mastery. It does not include answers to the tasks provided. Those are
Subjects:
Grades:
7th - 9th
Types:
Also included in: Math 8 Unit 19 Fractions, Percents, and Statistics
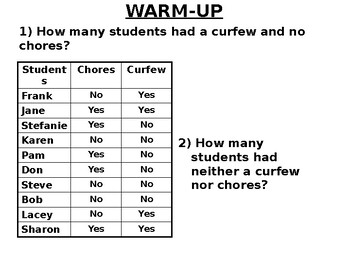
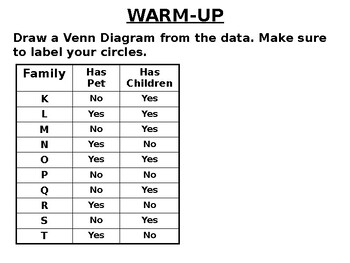
Math 8 19.1 Put Data into Venn Diagrams and Frequency Tables
This editable lesson was written by Alex Benn using the concepts described in his book Tenacious-Teaching: Uniting Our Superpowers to Save Our Classrooms and his website: Tenacious-Teaching.com. It includes an introductory warm-up designed to remediate the required prerequisite knowledge; concise notes; tasks that require escalating effort; numerous examples to prevent misconceptions; and in-class practice problems to promote mastery. It does not include answers to the tasks provided. Those are
Subjects:
Grades:
7th - 9th
Types:
Also included in: Math 8 Unit 19 Fractions, Percents, and Statistics
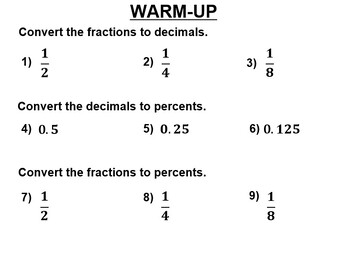
Math 8 19.3 Fractions to Decimals to Percents
This editable lesson was written by Alex Benn using the concepts described in his book Tenacious-Teaching: Uniting Our Superpowers to Save Our Classrooms and his website: Tenacious-Teaching.com. It includes an introductory warm-up designed to remediate the required prerequisite knowledge; concise notes; tasks that require escalating effort; numerous examples to prevent misconceptions; and in-class practice problems to promote mastery. It does not include answers to the tasks provided. Those are
Subjects:
Grades:
7th - 9th
Types:
Also included in: Math 8 Unit 19 Fractions, Percents, and Statistics
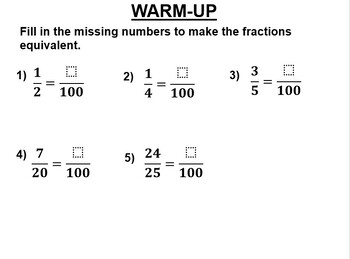
Math 8 19.2 Convert Fractions to Percents
This editable lesson was written by Alex Benn using the concepts described in his book Tenacious-Teaching: Uniting Our Superpowers to Save Our Classrooms and his website: Tenacious-Teaching.com. It includes an introductory warm-up designed to remediate the required prerequisite knowledge; concise notes; tasks that require escalating effort; numerous examples to prevent misconceptions; and in-class practice problems to promote mastery. It does not include answers to the tasks provided. Those are
Subjects:
Grades:
7th - 9th
Types:
Also included in: Math 8 Unit 19 Fractions, Percents, and Statistics
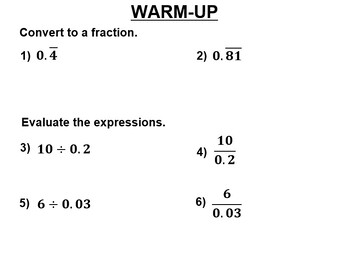
Math 8 19.5 More Repeating Decimals to Fractions
This editable lesson was written by Alex Benn using the concepts described in his book Tenacious-Teaching: Uniting Our Superpowers to Save Our Classrooms and his website: Tenacious-Teaching.com. It includes an introductory warm-up designed to remediate the required prerequisite knowledge; concise notes; tasks that require escalating effort; numerous examples to prevent misconceptions; and in-class practice problems to promote mastery. It does not include answers to the tasks provided. Those are
Subjects:
Grades:
7th - 9th
Types:
Also included in: Math 8 Unit 19 Fractions, Percents, and Statistics
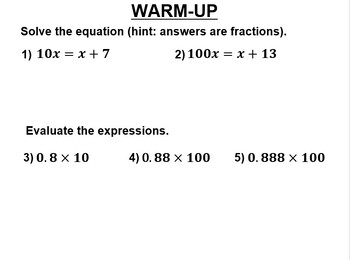
Math 8 19.4 Repeating Decimals to Fractions
This editable lesson was written by Alex Benn using the concepts described in his book Tenacious-Teaching: Uniting Our Superpowers to Save Our Classrooms and his website: Tenacious-Teaching.com. It includes an introductory warm-up designed to remediate the required prerequisite knowledge; concise notes; tasks that require escalating effort; numerous examples to prevent misconceptions; and in-class practice problems to promote mastery. It does not include answers to the tasks provided. Those are
Subjects:
Grades:
7th - 9th
Types:
Also included in: Math 8 Unit 19 Fractions, Percents, and Statistics
Math 8 Review Unit 19 Fractions Percents Statistics
This editable lesson was written by Alex Benn using the concepts described in his book Tenacious-Teaching: Uniting Our Superpowers to Save Our Classrooms and his website: Tenacious-Teaching.com. It includes an introductory warm-up designed to remediate the required prerequisite knowledge; concise notes; tasks that require escalating effort; numerous examples to prevent misconceptions; and in-class practice problems to promote mastery. It does not include answers to the tasks provided. Those are
Subjects:
Grades:
7th - 9th
Types:
Also included in: Math 8 Unit 19 Fractions, Percents, and Statistics
Scatterplots, Correlation and the Bite/Length of a Candy
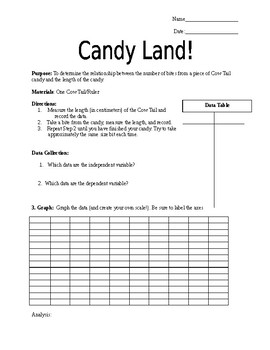
This is a lesson to show the scatterplot/correlation between the length of a candy bar and the bite number (ie, students measure a candy bar, take a bite, remeasure, etc). Skills used include: interpreting scatterplots, finding a line of best fit and slope, and understanding slope and y-intercept in a real world situation.
Showing 1-24 of 212 results


