22 results
High school statistics laboratories $5-10
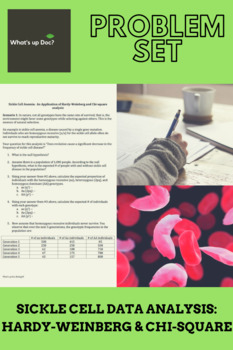
Sickle Cell Data Analysis: Hardy-Weinberg and Chi-Square
Want a great way to convert the "traditional" Hardy-Weinberg lab into a data problem set? Here it is! This is ideal for very small classes, where sample size could be an issue, busy classes, where you may need this for additional at-home practice, or very large classes, where the swapping of H-W cards could get too messy.Included is the full data problem set and teacher pages with the answer key.This data problem set covers:-genotypes and phenotypes-the Hardy-Weinberg equation, with application
Subjects:
Grades:
10th - 12th, Higher Education
Types:
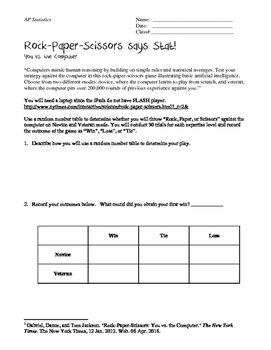
Rock, Paper, Scissors says Stat: A Chi-Square Lab
Students will utilize a Rock, Paper, Scissors website provided by the New York Times to determine whether the computer throwing Rock, Paper, Scissors is truly random. Students are asked to play the game 30 times in both modes. In addition, students are asked to call back ideas of simulation and probability to review previous learned concepts in preparation for the AP Exam to eliminate the confounding variables associated with human behavior.Please find an updated link to the simulator here: ht
Subjects:
Grades:
9th - 12th, Higher Education
Types:
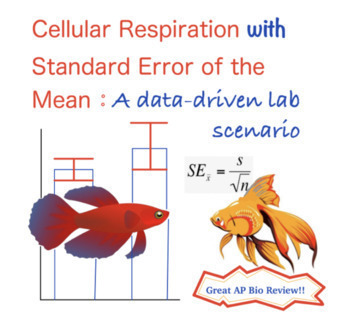
Cellular Respiration Think-it-Through Lab with Standard Error
This activity allows students to review basic concepts of cellular respiration in the context of a lab scenario. Students will work with data and complete calculations including percent change, mean, standard deviation, and standard error. In addition, students will see how error bars are drawn and learn how to interpret them on a graph. Activity A: Introduction (background, lab design, etc)Activity B: Working with data (percent change and mean calculations)Activity C: Calculating standard e
Subjects:
Grades:
9th - 12th, Higher Education, Adult Education
Types:
Also included in: Cell Resp Think-It-Through Lab with Standard Error and Answer Key
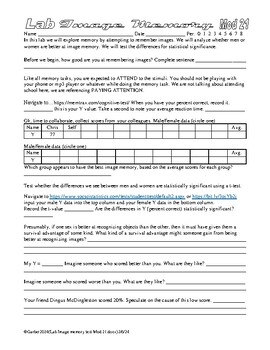
Psychology Lab Image Memory and Sex Differences AP Psychology Statistics
In this set of 13 labs the students do a variety of image memory tasks. They then collaborate and share data, then perform a T test on the data to find out if the differences between the scores of men and women are statistically significant. The students also test for correlations between a variety of scores. I suppose it is a sort of an expansion on my face memory lab. Links sometimes die, so try before you buy… https://www.psychologytoday.com/us/tests/iq/memory-test https://memtrax.com/cogniti
Subjects:
Grades:
9th - 12th, Higher Education, Adult Education
Types:
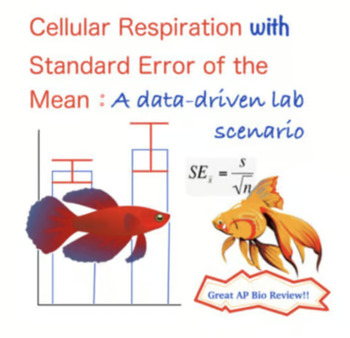
Cell Resp Think-It-Through Lab with Standard Error and Answer Key
This activity allows students to review basic concepts of cellular respiration in the context of a lab scenario. Students will work with data and complete calculations including percent change, mean, standard deviation, and standard error. In addition, students will see how error bars are drawn and learn how to interpret them on a graph.Activity A: Introduction (background, lab design, etc)Activity B: Working with data (percent change and mean calculations)Activity C: Calculating standard error
Subjects:
Grades:
11th - 12th
Types:
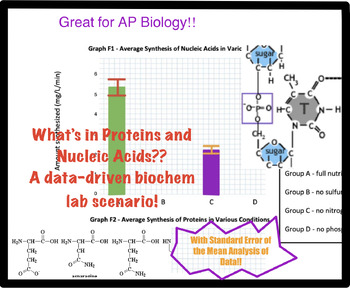
Proteins & Nucleic Acids - What's in Them? Biochem analysis w/ Standard Error
This activity allows students to review basic information related to the 4 classes of biological macromolecules and carbon before exploring the chemical composition of proteins and nucleic acids in this "minds-on" data-driven activity. Students will work with data and complete calculations including percent change, mean, standard deviation, and standard error. In addition, students will see how error bars are drawn and learn how to interpret them on a graph, ultimately reaching conclusions abou
Subjects:
Grades:
9th - 12th
Types:

WHO'S YOUR DADDY? Corn Genetics Unit WITH Guided Inquiry Lab
50 PAGE Mendelian Genetics Unit with a Guided Inquiry Lab using an optional Chi-Squared Statistical Test.
This can be done as a lab or can just be used as a PowerPoint presentation on Genetics and/or Meiosis.
THIS LAB IS BEST USING THE REAL EARS OF CORN BUT CAN BE DONE WITH THE PHOTOS AT THE END. CORN EARS CAN BE OBTAINED FROM BIOLOGICAL SUPPLY COMPANIES OR YOUR GARDEN. :)
This lab covers the following concepts:
1. Corn Genetics, Monohybrids and Dihybrids
2. Corn (Plant) Reproduction (Ani
Subjects:
Grades:
7th - 12th, Higher Education, Adult Education

Paper Airplanes: Intro to Statistical Analysis
This is an experiment designed to be part of a Scientific Method unit in a science class. It introduces students to the idea of writing lab reports and using statistical analysis tools such as standard deviation, averages, T-Tests, and Null and Alternative Hypothesis. It can be modified depending on students comfort level with lab report writing and google sheets. There will be a supplemental product that has the Google Sheet Provided.
Subjects:
Grades:
9th - 12th
Types:
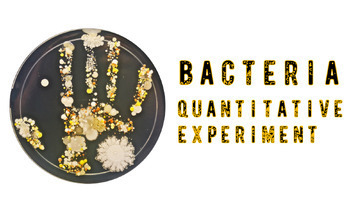
Bacteria Quantitative Experiment
This lesson teaches students how to apply quantitative methods to an experiment. Student’s T-Test Background Info introduces students to statistical hypothesis testing, alternative hypothesis, null hypothesis, and t-tests. After students learn about t-tests, they view the Bacteria Quantitative Experiment. This experiment compares the growth of bacteria on agar plates swabbed from hands that weren’t cleaned, and cleaned with hand sanitizer, regular soap, and antibacterial soap. There are pictures
Subjects:
Grades:
9th - 12th, Higher Education
Types:
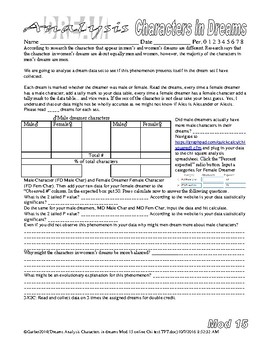
Psychology Dream Analysis Characters and Emotions in Dreams Freud
In these two labs the students analyze a dream set for characters, emotions and animals in dreams respectively. Research says that the characters in women’s dreams are about 50/50, men and women, but in men’s dreams there are more male characters than female characters. One of the labs focuses on this phenomenon. We endeavor to see if this is true in our dream set. The second lab focuses on whether whether or not men or women have more negative or positive dreams. 11/8/22 Animals in dreams is no
Subjects:
Grades:
10th - 12th, Higher Education
Types:
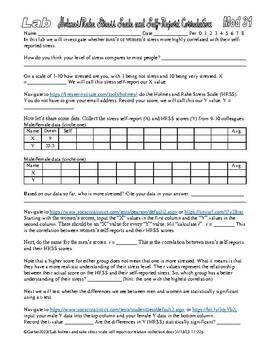
Psychology Lab Stress Correlations 2 AP Psychology Statistics Holmes Rahe
This is another version of my stress correlation labs, it simply relies on a different stress measurement tool.In this collection we make use of the Holmes and Rahe Stress Scale (HRSS) at… https://kresserinstitute.com/tools/holmes/ In this lab the students check the correlation between stress as measured by the HRSS and a variety of self-reports. I have included… Holmes and Rahe Stress and stress self-report Attending and Holmes and Rahe stress correlation Holmes and Rahe Stress and alertness s
Subjects:
Grades:
8th - 12th, Higher Education, Adult Education
Types:
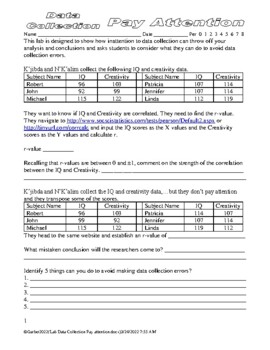
Data Collection: Pay Attention Correlation Statistics Psychology Methods
This lab is designed to show how inattention to data collection can throw off your analysis and conclusions and asks students to consider what they can do to avoid data collection errors. The best part is THAT THEY ARE ALL UNIQUE! Wait, what,…. Every single page is different to minimize copying and cheating! 495 different versions. The students are given a data collection scenario. In the first sample the students use a website to find the r-value of the data. Every assignment has an r-value of
Subjects:
Grades:
9th - 12th, Higher Education
Types:
Statistics Activities Bundle
This bundle has 2 labs, 1 project, and a movie worksheet to Luca.
Subjects:
Grades:
6th - 10th
Types:
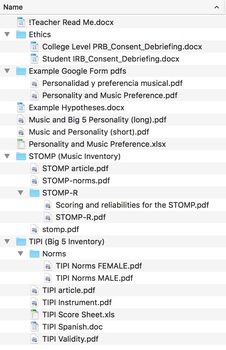
AP Psychology Correlational Experiment (Lab Materials)
These are materials to create a project of a correlational study of music genre preference with Big 5 Personality Traits. The students work to set up and collect their own data from their peers. It introduces experiment ethics, experimental design, psychological research inventories, data collection, statistical analysis, and more. This ZIP file contains all the materials needed for an introduction to research methods and correlational statistics. It does NOT contain an assignment sheet. These m
Subjects:
Grades:
9th - 12th, Higher Education
Types:
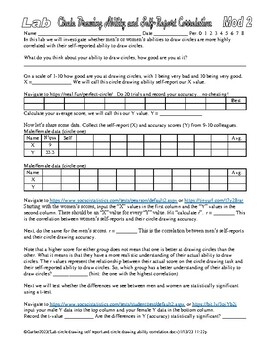
Psychology Lab Circle Drawing and Correlation Collection AP Psychology Stats
In this collection we make use of the circle drawing activity at… https://neal.fun/perfect-circle/ This collection contains a number of different versions. These will be useful if you want correlation data or if you are working on sensation and perception or dexterity,…use your imagination. In these labs, the statistical analysis is done by calculators on websites. If you teach stats you may want to block out the links and have the students work the calculations by hand….. or maybe even have the
Subjects:
Grades:
9th - 12th, Higher Education
Types:
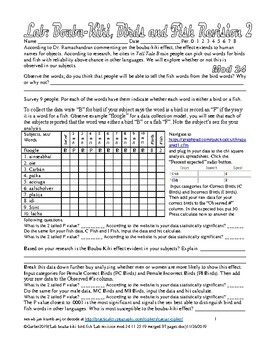
Psychology Lab Bouba Kiki Bird Fish lab Cognition Language
According to Dr. Ramachandran, commenting on synesthesia and the bouba-kiki effect, the effect extends to human names for objects. According to research he cites in Tell Tale Brain, people can pick out words for birds and fish with reliability above chance in other languages. We will explore whether or not this is observed in our population.Survey 24 non-psych friends. For each of the words have them indicate whether each word is either a bird or a fish.This is cool because my students almost al
Subjects:
Grades:
9th - 12th, Higher Education, Adult Education
Types:
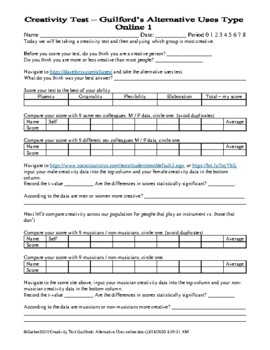
Psychology Lab Guilford's Alternative Uses Online AP Psychology Creativity
Creativity test Guilford’s alternative uses test online description I found the Guilford’s Alternative Uses Test online and decided to base a couple of labs on it. There are 6 labs in this set in two basic versions. In the first set there are two labs. In the first the students run an online “t” test to find out if the differences between men’s and women’s scores and musicians and non-musicians scores are statistically significant. In the second the students run an online “t” test to find out if
Subjects:
Grades:
9th - 12th, Higher Education, Adult Education
Types:
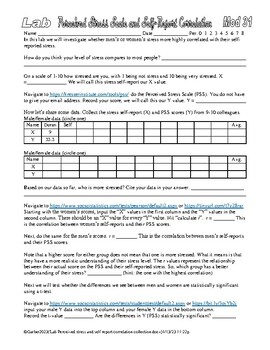
Psychology Lab Stress Correlations AP Psychology Statistics Perceived Stress
In this collection we make use of the Perceived Stress Scale (PSS) at… https://kresserinstitute.com/tools/pss/ In this lab the students check the correlation between stress as measured by the PSS and a variety of self-reports. I have included… Stress and stress self-report Attending and stress correlation Stress and alertness self-report Stress and sleepiness self-report Stress and depression self-report Stress and hunger self-report Stress and anger self-report Stress and happiness self-report
Subjects:
Grades:
8th - 12th, Higher Education, Adult Education
Types:
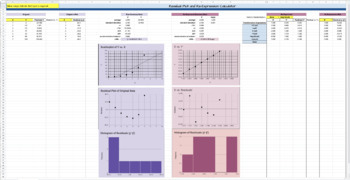
APStat: Residual and Re-expression Calculator
In AP Statistics, re-expression variables to fit an LSRL can be cumbersome on the calculator, without any real benefit to the student. This calculator is programmed to help students to easily see the relationship between a scatterplot and its residual plot for both re-expressed and raw (x,y) data values. This is a great tool to help students explore the Ladder of Powers for non-linear scenarios. The only values that need to be input are the raw data points. Students can also select the trans
Subjects:
Grades:
9th - 12th, Higher Education, Staff
Types:

Homeostasis Heart Rate Lab
This lab can be used for middle school sciences, any Biology-based science class, or mathematics statistics classes. Included are a word document with instructions, lab, an excel spreadsheet with example data, a blank sheet with formulas that will calculate data, and a PowerPoint with student instructions.
Subjects:
Grades:
6th - 12th, Higher Education
Types:
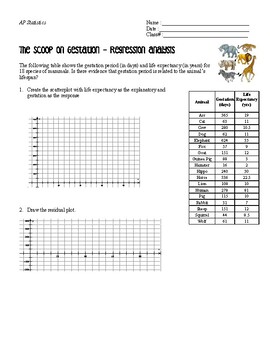
The Scoop on Gestation: Influential Points and Linear Regression
This lab takes a look at the average gestation of a variety of animals and asks students to perform a linear regression analysis. It explores the impact of influential points. The lab incorporates verbiage that should be used on the AP Exam and formal analyses.
Subjects:
Grades:
9th - 12th, Higher Education
Types:
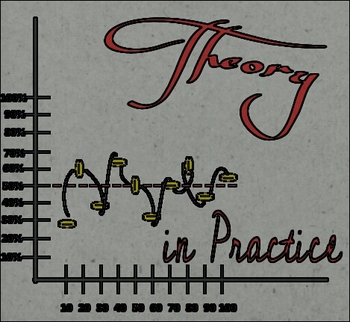
Theory in Practice
This activity requires students to flip a coin 100 times and calculate the cumulative probability for each trial of ten. Students should begin to develop the concept of theoretical versus experimental probability as the cumulative number of flips increases. Recognizing independent events, graphing scatter plots, and calculating percentages are skills students will practice during this activity. Teachers may use this activity as an introductory lesson for a unit on probability, in a statistics
Subjects:
Grades:
7th - 12th
Types:
Showing 1-22 of 22 results


