75 results
High school statistics graphic organizers $5-10
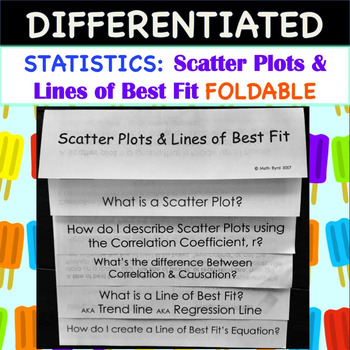
Statistics:Scatter Plots and Lines of Best Fit FOLDABLE
So Easy to Use! Simply print and fold! No need to rotate pages! Scatter Plots and Lines of Best Fit FOLDABLE also includes a PowerPoint to go along with the foldable.Foldable has 2 tiers of differentiation, perfect for the inclusive classroom! 1 set has fill-in-the-blank style notes within the foldable, while the other foldable has the notes already filled in. On both sets, students will have to work out the examples.Students will learn how to: Create Scatter PlotsDescribe Scatter Plots using Co
Subjects:
Grades:
8th - 11th
CCSS:
Also included in: Common Core Algebra 1: STATISTICS UNIT - BUNDLE PRICE!
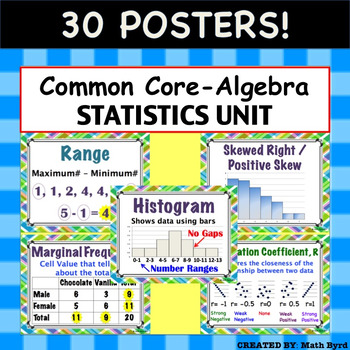
Common Core Algebra - Statistics Unit: Describing Data POSTERS
30 Posters! Each 8.5" x 11" in size. Posters are aligned with Common Core's Algebra - Statistics: Describing Data Unit. Posters Included:MeanMedianModeRangeInterquartile RangeOutlierMean Absolute DeviationMeasures of CenterMeasures of SpreadDot PlotHistogramBox PlotNormal/ Bell Shaped DistributionSkewed Right/Positive SkewSkewed Left/ Negative SkewUniform2 Way Frequency TableJoint FrequencyMarginal Frequency2 Way Relative Frequency TableConditional Relative FrequencyScatter PlotCorrelationCorrel
Subjects:
Grades:
8th - 11th
CCSS:
Also included in: Common Core Algebra 1 POSTERS - BUNDLE PRICE!
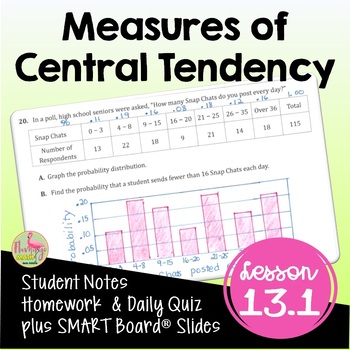
Measures of Central Tendency (Algebra 2 - Unit 13)
Measures of Central Tendency Algebra 2 Lesson:Your Pre-AP Algebra 2 Honors students will draw, analyze and interpret box-and-whisker plots, find outliers, and calculate measures of central tendency in this unit 13 lesson on Data Analysis & Statistics that cover the concepts in depth. #distancelearningtptWhat is included in this resource?⭐ Guided Student Notes⭐ Google Slides®⭐ Fully-editable SMART Board® Slides⭐ Homework/Practice assignment⭐ Lesson Warm-Up (or exit ticket)⭐Daily Content Quiz
Subjects:
Grades:
8th - 11th, Higher Education
CCSS:
Also included in: Algebra 2 Curriculum Mega Bundle | Flamingo Math
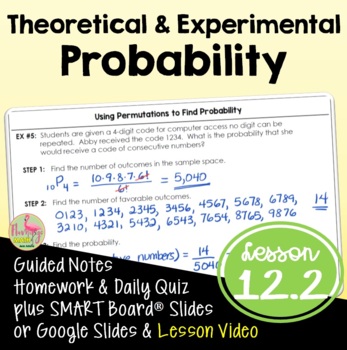
Theoretical and Experimental Probability (Algebra 2 - Unit 12)
Theoretical & Experimental Probability Algebra 2 Lesson:Your Pre-AP Algebra 2 Honors students will find both experimental and theoretical probabilities in this Unit 12 lesson. #distancelearningtptWhat is included in this resource?⭐ Guided Student Notes⭐ Google Slides®⭐ Fully-editable SMART Board® Slides⭐ Homework/Practice assignment⭐ Lesson Warm-Up (or exit ticket)⭐ Daily Content Quiz (homework check)⭐ Video Lesson Link for Distance Learning - Flipped Classroom models⭐ Full solution setStude
Subjects:
Grades:
8th - 11th, Higher Education
CCSS:
Also included in: Algebra 2 Curriculum Mega Bundle | Flamingo Math
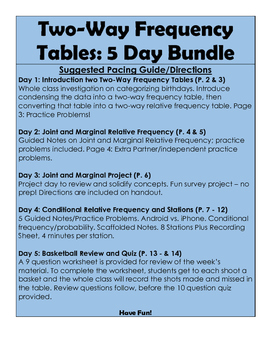
Two-Way Frequency Tables BUNDLE: 5 days - no prep!
This 5 day bundle introduces two way frequency tables, joint and marginal relative frequency, as well as conditional relative frequency. Guided notes, practice problems, and a project is included. The notes are scaffolded and the practice problems help students to solidify the concepts. Stations and a review activity is also provided, as well as a 10 question quiz. A pacing guide is given, but you may also reorganize the lessons if you please. This thorough 5-day bundle helps students to access
Subjects:
Grades:
8th - 9th
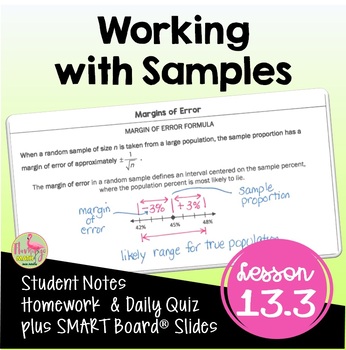
Working with Samples (Algebra 2 - Unit 13)
Working with Samples Algebra 2 Lesson:Your Pre-AP Algebra 2 Honors students will find draw, analyze and interpret box-and-whisker plots, find outliers, and calculate measures of central tendency in this unit 13 lesson on Data Analysis & Statistics that cover the concepts in depth. #distancelearningtptWhat is included in this resource?⭐ Guided Student Notes⭐ Google Slides®⭐ Fully-editable SMART Board® Slides⭐ Homework/Practice assignment⭐ Lesson Warm-Up (or exit ticket)⭐Daily Content Quiz (ho
Subjects:
Grades:
8th - 11th, Higher Education
CCSS:
Also included in: Algebra 2 Curriculum Mega Bundle | Flamingo Math
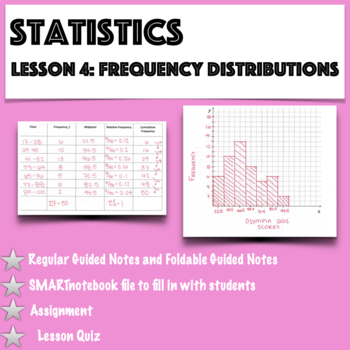
Statistics - Lesson 4: Frequency Distributions and their Graphs
This is the 4th lesson for an introductory statistics course and 1 of 5 lessons in this unit.Students will: -Be introduced to key vocabulary -Create a frequency distribution -Make a histogram, a frequency polygon, and an ogiveThere is another version of this lesson that comes with a video (see my store).In addition to guided notes (foldable or regular guided notes), the following is included: -SMARTnotebook file for the teacher to fill in with the students -Assignment to
Subjects:
Grades:
9th - 12th, Higher Education
Also included in: Statistics- Unit 2 Bundle: Describing Statistics

Normal Distribution Foldable Popup
This is a popup of a normal distribution graph, showing students the probable spread of data within 1, 2, 3, and 4 standard deviations of the mean. The formulas for the population standard deviation and the sample standard deviation are both included. It is a great reference/graphic organizer for student notebooks and I have even had students who weren't in my class ask to join because they wanted this popup too. Useful for math or maths class, great for visual and kinesthetic learners, and
Subjects:
Grades:
9th - 12th, Higher Education, Adult Education
CCSS:

Misleading Statistics
Did you know that 90% of all serial killers are right-handed?
Well, of course... 90% of all people in general are right-handed.
This is a great activity that can be used as an introduction to any statistics class or unit. It makes students think about how people misinterpret statistics and how two people can look at the same data and draw different conclusions.
Subjects:
Grades:
7th - 12th, Higher Education, Adult Education
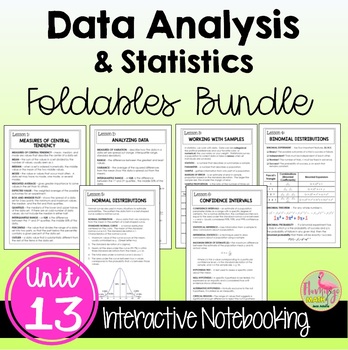
Data Analysis and Statistics FOLDABLES™ (Algebra 2 - Unit 13)
This bundle of 8-page Bound-Book-Style Foldables includes six lessons on topics in UNIT 13: Data Analysis & Statistics for your Algebra 2 Honors students. A set of finished notes and directions for creating the Foldables are also included.⭐ Bonus: A set of Google Slides for presenting the lesson and video lesson links are now included for distance learning and flipped classroom methods.☆FOLDABLESThree options of an 8-page Bound-Book Foldable® will help with differentiation.Option #1: All voc
Subjects:
Grades:
8th - 11th, Higher Education
CCSS:
Also included in: Algebra 2 Curriculum Big Bundle | Flamingo Math
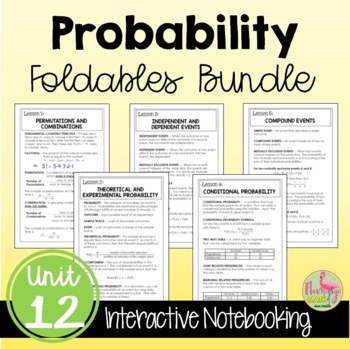
Probability FOLDABLES™ (Algebra 2 - Unit 12)
There are five lessons in UNIT 12: Probability for your Algebra 2 Honors students. A set of finished notes and directions for creating the Foldables are also included.⭐ Bonus: A set of Google Slides for presenting the lesson and video lesson links are now included for distance learning and flipped classroom methods.You can choose between three options of an 8-page Bound-Book-Style Foldable™Option #1: All vocabulary, formulas, and theorems are included. Students work through examples while you te
Subjects:
Grades:
8th - 11th, Higher Education
CCSS:
Also included in: Algebra 2 Curriculum Big Bundle | Flamingo Math
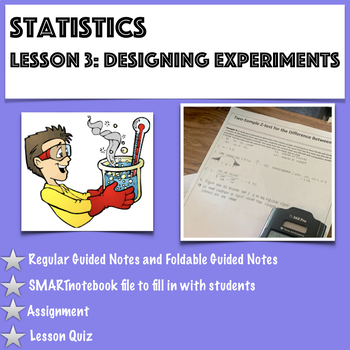
Statistics - Lesson 3: Designing an Experiment
This is lesson 3 of Unit 1. Updated 8-23-19If you are interested in purchasing the whole curriculum, visit my store. I sell the whole curriculum with videos of the lessons and without videos. In this lesson students will: -Be exposed to the different statistical studies -Learn how data is collected by doing observational studies, experiments, simulations, or surveys -Learn how experiments are designed -Know how to sample by using random sampling techni
Subjects:
Grades:
9th - 12th, Higher Education
Also included in: Statistics-Unit 1 Bundle: Introduction to Statistics

Statistical Inference Bundle
This bundle contains 6 products that I use during the old unit 4, now units 6-8 of the new CED, of AP Statistics. There are 3 notes sheets, a foldable, one activity, and a review worksheet. My two-sample examples are exclusive to this bundle.These will download as a zip file.If you like this product, please consider following my store and checking out other products. I would love to hear your feed-back in your review.
Subjects:
Grades:
12th, Higher Education
AP Statistics - Two Variable Statistics Part 3: Least-Squares Regression
This is the twelfth lesson, in a series of 14 lessons, in the Descriptive Statistics Unit for AP Statistics.
Students will:
-Find and interpret the slope and y-intercept of a least-squares regression line
-Use the LSRL to predict y for a given x
-Find and interpret residuals
-Find the LSRL with technology
In addition to the guided notes (foldable book notes or regular guided notes), the following is included:
SMARTnotebook file for the teacher to fill in with the students
Ho
Subjects:
Grades:
9th - 12th
Also included in: AP Statistics- Chapter 4 Bundle: Correlation and Regression
AP Statistics - Two Variable Statistics Part 2: Correlation and Scatterplots
This is the eleventh lesson in a series of 14 lessons in the Descriptive Statistics Unit for AP Statistics.
Students will:
-Be able to identify outliers in a scatterplot
-Estimate the strength of relationships using a scatterplot
-Use technology to calculate the correlation coefficient
-Know the key facts about correlation
In addition to the guided notes (foldable book notes or regular guided notes), the following is included:
SMARTnotebook file for the teacher to fill in
Subjects:
Grades:
9th - 12th
Also included in: AP Statistics- Chapter 4 Bundle: Correlation and Regression
AP Statistics-Discrete and Continuous Random Variables:Probability Distributions
This is the fifth lesson in the Probability Unit for AP Statistics and the first lesson in a series of five lessons covering random variables.Students will: -Calculate probabilities using a probability distribution -Calculate the mean of a discrete random variable and interpret it in context -Calculate the standard deviation of a discrete random variable and interpret it in context -Graphically display a probability model -Use normal approximation to calculate probabili
Subjects:
Grades:
9th - 12th, Higher Education
Also included in: AP Statistics-Chapter 6 Bundle:Random Variables
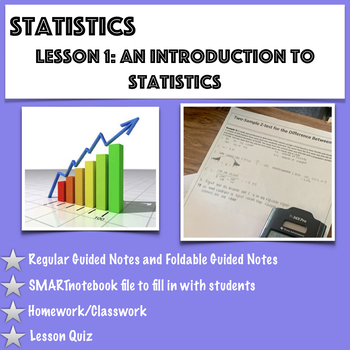
Statistics - Lesson 1: Introduction to Statistics
Updated 8-17-19This is the first lesson for an introductory statstics course and 1 of 3 lessons in this chapter.Students will: -Be introduced to key vocabulary -Distinguish between a population and a sample -Distinguish between a parameter and a sample -Distinguish between descriptive statistics and inferential statisticsIn addition to the guided notes (foldable book notes or regular guided notes), the following is included:SMARTnotebook file for the teacher to fill in with the s
Subjects:
Grades:
10th - 12th, Higher Education
Also included in: Statistics-Unit 1 Bundle: Introduction to Statistics
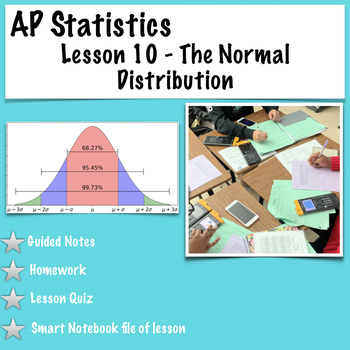
AP Statistics. Lesson 10-The Normal Distribution
Unit 1 Lesson 10 of the AP Statistics CurriculumIf you are interested in purchasing the whole curriculum, click on the links below.AP Statistics: Whole CurriculumAP Statistics: Whole Curriculum with videos of lessonsIncluded in this download:Guided NotesNotes for teacherLesson KeySMART notebook file of the guided notes to fill in with students2 Assignments (Homework/Classwork)Lesson Quiz (key included)Power Point Presentation of lessonKeynote Presentation of LessonLink to supplemental materialLi
Subjects:
Grades:
9th - 12th, Higher Education
Also included in: AP Statistics - Unit 1 Bundle: Exploring One Variable Data
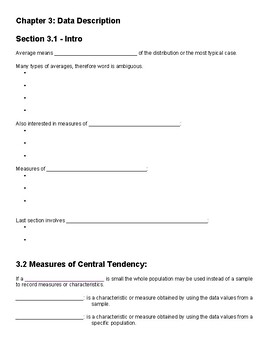
Introduction to Statistics Chapter 3 Bundle
Chapter 3: Data DescriptionPreview includes first page from some of the following:Items Included:- Chapter 3 Guided Notes (.pdf, .docx, & .notebook)- Chapter 3 Guided Notes Key- Chapter 3.1 - 3.2 Flip Card Activity (.docx)- Chapter 3.1 - 3.3 Kahoot Assignment- Chapter 3.1 - 3.3 Review & Test (.pdf & .docx)- Chapter 3.4 Review Activity (.pdf & .docx)- Chapter 3.4 - 3.5 Review & Test (.pdf & .docx)
Subjects:
Grades:
10th - 12th
Statistics - Introduction to Normal Distributions
In this lesson, which is the first of five lessons, students will learn the properties of normal distributions, interpret graphs of normal distributions, and they will find areas under the standard normal curve.
These lessons are set up to have the teacher lead the students through the note-taking process while incorporating examples for the students to try. The answer keys are provided. Homework is included. I will also be making videos that take the student through the lesson for those that
Subjects:
Grades:
9th - 12th, Higher Education
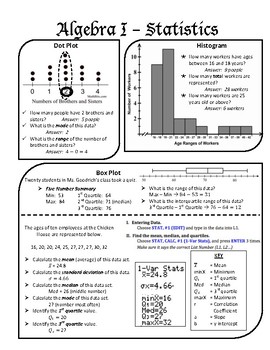
Algebra I Statistics Study Guide
Includes: dot plot, histogram, box plot (using the calculator to get the values to create box plot), two way frequency tables, scatterplot (w/ calculator steps), linear regression (w/ calculator steps), exponential regression (w/ calculator steps), correlation coefficients (w/ calculator steps), residuals
Subjects:
Grades:
8th - 12th
Statistics - Introduction to Hypothesis Tests
In this lesson students will:
-Be exposed to key vocabulary
-State a null and alternative hypothesis
-Identify the claim
-Describe type I and type II errors
-Determine if a test is left-tailed, right-tailed, or two-tailed
The lesson is very long so it is broken into parts 1 and 2. Each part will take a class period to complete.
These lessons are set up to have the teacher lead the students through the note-taking process while incorporating examples for the students to
Subjects:
Grades:
9th - 12th, Higher Education
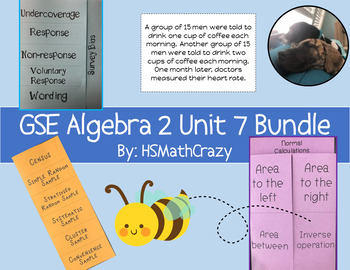
GSE Algebra 2 Unit 7 Bundle
This product contains 6 products: 3 foldables, 1 notes sheet, and 2 activities. These products align to Unit 7 of Georgia's Algebra 2 standards but would work in a variety of statistics courses. If you like this product, please consider following my store and checking out other products. I would love to hear your feed-back in your review.
Subjects:
Grades:
11th - 12th
AP Statistics - Two Variable Statistics Part 1: Correlation
This is the tenth lesson in a series of 14 lessons in the Descriptive Statistics Unit for AP Statistics.
Students will:
-Define key vocabulary terms
-Identify the explanatory and response variables
-Create a scatterplot to graph the relationship between two quantitative variables
-Describe the direction, form, outliers, and strength of a scatterplot (D.O.F.S)
In addition to the guided notes (foldable book notes or regular guided notes), the following is included:
SMART
Subjects:
Grades:
9th - 12th
Also included in: AP Statistics- Chapter 4 Bundle: Correlation and Regression
Showing 1-24 of 75 results


