750 results
High school statistics lessons under $5
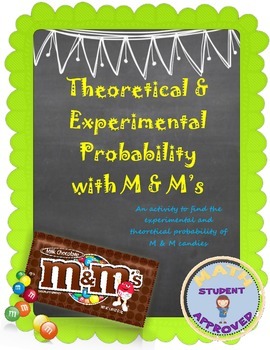
Theoretical and Experimental Probability M&M activity
Students need to find the probability of picking certain colored M&Ms, and asked to change them into decimals, fractions, and percents. They are asked to draw specific M&Ms at random for experimental probability problems. They are asked to make a few predictions, as well. This is a lengthy lesson and takes a while to get through, so make sure you have enough time to get through it. It can be done in 2 days, and if you need to use colored chips or counters instead, go for it!
Subjects:
Grades:
5th - 11th
Types:
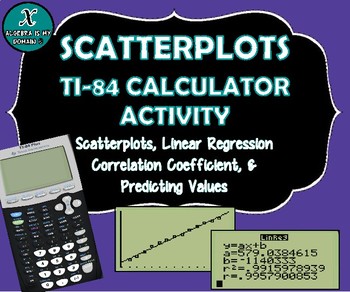
TI-84 CALCULATOR ACTIVITY - Data, Scatterplots, Regression & Line of Best Fit
This file includes four linear regression examples (all real-life data). The examples cover the following topics for the TI-84 graphing calculator:
* Creating a scatterplot
* Performing linear regression (finding the equation of the best-fit line)
* Interpreting the slope of the equation
* Calculating and interpreting the correlation coefficient
* Predicting values (using the linear regression equation)
The first example gives the step-by-step instructions to calculate all the necessary value
Subjects:
Grades:
7th - 12th, Higher Education
Types:
CCSS:
Mean Absolute Deviation - Class Challenge
Are you looking for an engaging way to teach Mean Absolute Deviation? Look no further! My students love completing this lesson.
This product is designed to help your students master the MAD in three easy steps.
1) Guided Notes – The guided notes contain an introduction to calculating MAD. Students will write the overall meaning of the MAD and the steps to calculating. There is an example problem for the teacher to model and then two “you try” problems for students to try independently a
Subjects:
Grades:
6th - 9th
Types:
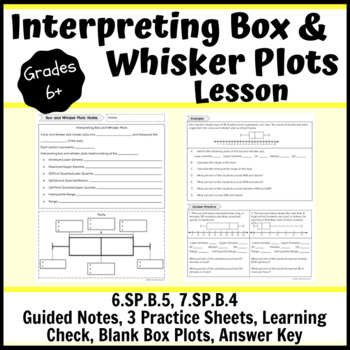
Interpreting Box and Whisker Plots Lesson- Notes, Practice, Learning Check
This interpreting box and whisker plots lesson consists of a guided notes sheet, 3 practice sheets, a learning check, 2 different half sheets of blank box plots and an answer key. You can hole punch the note pages and have students place them in their binders or a 3-prong folder. There are teacher notes to guide you through the direct instruction with students. There are three pages of practice. One page can be used as independent practice when students are ready; this could be in class or homew
Subjects:
Grades:
6th - 10th
Types:
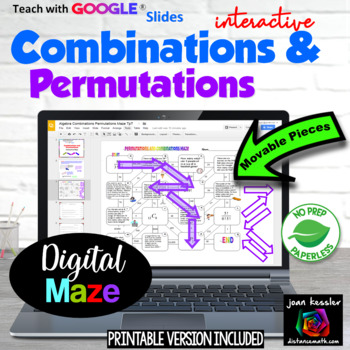
Permutations and Combinations Digital Maze + HW and Printable version
This Combinations, Permutations, and Counting Fun Maze is NO PREP for you and engaging,challenging, and fun for your students. This resource included both a digital and printable version. This activity reinforces the concepts of permutations, combinations, and counting principles and is great practice. The different types of problems are placed randomly in the maze so that students must first decide the type of question before solving. The questions on the maze are letter coded so that if a s
Subjects:
Grades:
8th - 11th
Types:
CCSS:
Also included in: Algebra 2 Digital MEGA Bundle plus Printables
High School Data Analysis Project
This project covers a large range of data analysis methods. There are eleven total parts to the project.
Part One: the students have to collect data from 20 students outside of the classroom. Directions specify to ask students from each grade level.
Part Two: Measures of Center and Variation. Students will calculate mean, median, mode, range, and standard deviation for some of the data collected. Definitions of each term are included.
Part Three: Box-And-Whisker Plot. Students will create t
Subjects:
Grades:
9th - 12th
Types:
CCSS:
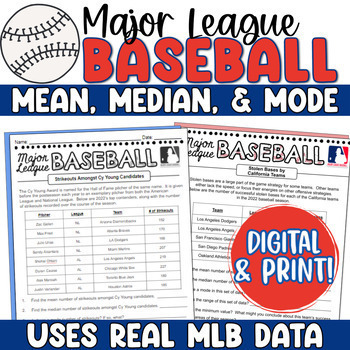
Baseball Math Mean, Median, Mode - MLB Baseball Measures of Central Tendency
This real-world baseball math statistics project asks students to determine mean, median, mode, and range for a variety of actual statistics from the 2023 Major League Baseball season. Perfect to excite any sports enthusiasts! It includes both a traditional print option and a digital version, made for Google for any 1:1 classrooms!Each slide within the activity is dedicated to a different statistic (for example, strikeouts amongst Cy Young candidates, or homeruns amongst MVP candidates). Stud
Subjects:
Grades:
6th - 9th
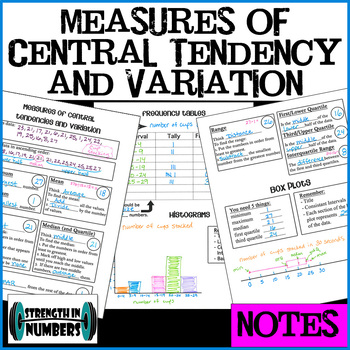
Interactive Notebook NOTES: Mean Median Mode Range Quartiles Box Plot Histogram
This set contains suggestions for student data collection and notes that use the data for measures of central tendencies and variation (mean, median, mode, range, first and third, quartiles, interquartile range, outliers), box plots, frequency tables, and histograms! Sounds like so much but these topics all go together so well. And by using data collected by students ABOUT students, they will be much more interested. This product contains ideas for collecting data, three full size (8.5x11) pa
Subjects:
Grades:
6th - 9th
Also included in: Complete BUNDLE of 50 Foldable Notes for Math 7
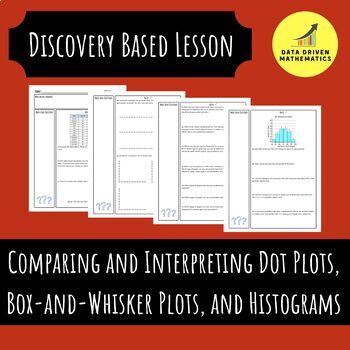
Comparing and Interpreting Dot Plots, Box-and-Whisker Plots, and Histograms
About This Resource:A four page packet containing an investigation into comparing and interpreting dot plots, box-and-whisker plots, and histograms. In addition, you will receive the answer key to help with the implementation of this activity in your classroom. The worksheet flows perfectly and could be used in more of a discovery format or a instructor guided notes.What's Included:You will receive a zipped folder. Inside the zipped folder is a worksheet and the answer key in PDF format.Similar
Subjects:
Grades:
6th - 10th
CCSS:
Constructing Box-and-Whisker Plots - Stations Activity
About This Resource:In this activity students will practice constructing box-and-whisker plots when provided a data set. Students will need to calculate the five number summary (minimum, first quartile, median, third quartile, and maximum) in order to be successful on this activity. The prep required by the teacher consists of printing the stations cards, making a copy of the graphic organizer for each student, and setting the expectations and instructions with their students.Your students will
Subjects:
Grades:
6th - 12th
Types:
CCSS:
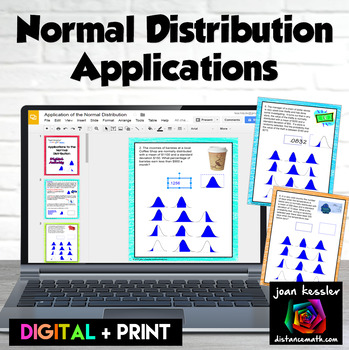
Normal Distribution Applications Digital Activity plus Print
In this digital interactive activity for Applications of the Normal Distribution your students will solve 10 real world applications of the Normal Distribution with GOOGLE® Slides. They will first analyze the problem, then “sketch” the scenario by selecting one of 12 shaded normal distribution diagrams, and then determine the solution either using technology or manually by tables using z-scores.A printable version of the questions is also included. Students will also read, analyze and sketch
Subjects:
Grades:
9th - 12th
Types:
CCSS:
Also included in: Probability and Statistics Algebra 2 Unit 11 Activity Bundle
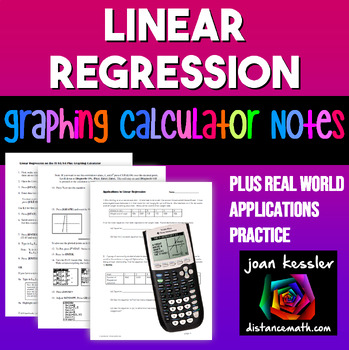
Linear Regression | TI-84 Graphing Calculator plus Applications
This clear, concise, step by step notes help your students use the TI 83 and TI 84 Graphing Calculator to enter data into lists, create a linear regression equation and to plot the equation along with the data simultaneously. Also included is a 3 page worksheet with five real world examples for students to practice. Solutions included. These can be used as Binder Notes or printed smaller for Interactive Notebooks._________________________________________________Related Products★ Quadratic Re
Subjects:
Grades:
9th - 11th, Higher Education
Types:
CCSS:
Also included in: Linear Functions and Systems Algebra 2 Unit 2 Activity Bundle
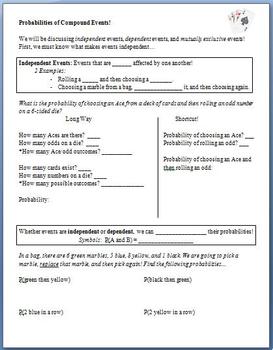
Probability of Compound Events (Guided Notes)
This lesson is meant to be used as guided notes for a whole class.
Students begin by learning what makes 2 events independent. After slowly working through a problem about rolling a die and choosing a card, they discover that they can multiply probabilities when working with these compound events. They then attempt problems involving picking marbles from a bag. Next, they learn about dependent events, and finally, mutually exclusive events.
The last 2 pages are a copy of the key.
Subjects:
Grades:
6th - 12th
Types:
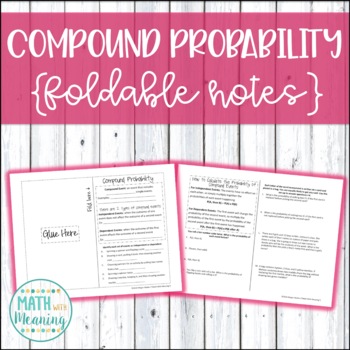
Compound Probability Foldable Notes Booklet - Aligned to CCSS 7.SP.C.8
These foldable notes are perfect for an interactive math notebook! In these notes, students will learn to whether compound events are independent or dependent and how to calculate the probability of compound events. Please view the preview file to determine if this product is appropriate for your students!An answer key is included.This activity is aligned to CCSS 7.SP.C.8.Please note that this activity is NOT editable. The text, problems, and images are not able to be changed.**Save money by buy
Subjects:
Grades:
6th - 9th
CCSS:
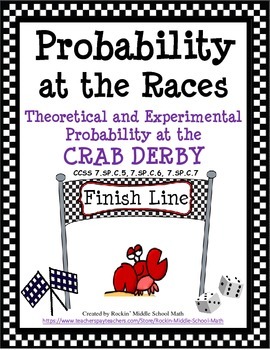
Probability-Theoretical and Experimental-Crab Derby Race CCSS 7.SP.C.5, 6, and 7
This is a fun, engaging 3 part activity including lesson plan that will have your kids so engaged they will forget they are actually learning math. Students will first work in groups/partners and simulate a crab derby race in a game using the sum of two dice to see whose crab will cross the finish line first. Then, they will complete a matrix of possible outcomes when two dice are tossed and added together to get particular sums. They will answer questions that apply to both theoretical and e
Subjects:
Grades:
5th - 9th
Types:
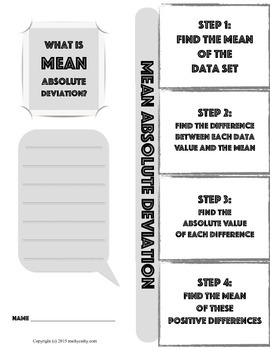
Mean Absolute Deviation Foldable Note-Taking Guide
This foldable will help make the process of learning how to calculate the mean absolute deviation of a data set easier to digest! In the new Texas TEKs, 8th grade students must be able to calculate the MAD of a small data set.
This foldable note-taking guide helps students take this process one step at a time. I encourage students to reference this structured example as they work more complex problems, and analyze the MAD of multiple data sets. This foldable guide is designed to get them s
Subjects:
Grades:
6th - 9th
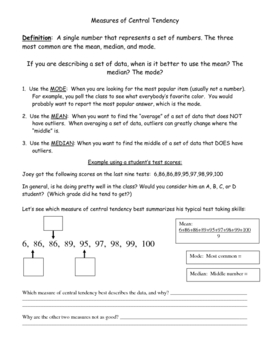
Measures of Central Tendency: When to use mean, median, or mode
Students can quickly learn how to find the mean, median, mode, or range of a set of data, but they have a harder time understanding when to use them. When is median better than mean? Mode better than median? This worksheet helps explain the different measures of central tendency.
Subjects:
Grades:
5th - 10th
Types:
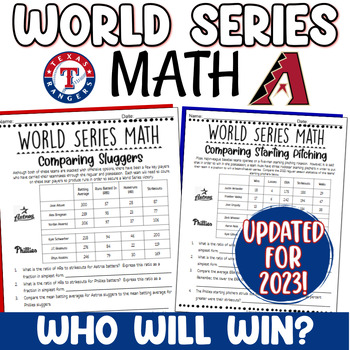
World Series Math 2023 Activity Real-World MLB Baseball Project PBL
This engaging World Series Math Activity compares the 2023 World Series teams using real-world statistics and is a perfect fall activity for your middle or high school classroom!Students explore the 2023 seasons of the Arizona Diamondbacks and Texas Rangers, comparing starting pitching, closers, prominent sluggers, fielding percentages, and postseason performances. After analyzing these statistics, students will be asked to award advantage to one team for each of these categories. Ultimately,
Subjects:
Grades:
6th - 9th
Finding the Standard Deviation of a set of numbers
Students learn the formula for standard deviation. This package consists of the following:1. Students are given different sets of numbers. They find the mean, variance, and standard deviation of each set. There is a fully-explained example followed by 8 problems.2. Students then compare the consistency of runners and football teams in the second activity. They are taught what the spread of data actually means. Along the way, students can use a template created to help with the computations. Of c
Subjects:
Grades:
8th - 11th
Types:
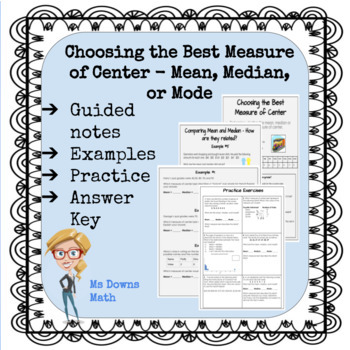
Choosing the Best Measure of Center - Mean, Median or Mode
This lesson is about how to choose which measure of center is best - Mean, Median, or Mode. I use this lesson in my Introduction to Statistics high school course.The guided lesson shows examples with skewed data and without. There is a practice (homework) assignment with 6 questions.An answer key to the entire lesson is provided as well.
Subjects:
Grades:
8th - 12th
Types:
Interpreting Graphs for the Middle & Junior High School: Book 2
Here is another set of data graphics for your students to analyze and interpret. Using survey results from the USA Today newspaper, students will be asked to explain what the graphics are illustrating. Each activity will ask the student to identify basic information presented in each graphic and make some projections based on the data given in the survey.
The activities in this packet are a great way to improve your student’s skills in taking apart graphic displays of information. Brin
Subjects:
Grades:
4th - 10th, Adult Education
Types:
Psychology Research Design: Correlations and Inferential Statistics
Engage students in a critical thinking activity that takes correlations and inferential statistics beyond simply words on a page. This resource primes their learning with a vocabulary doodle note. Students then work collaboratively to arrange terms and justify their relationships in a hexagon card sort. Finally, students apply their understanding of correlation & statistics in an application activity that will surely spark discussion in your classroom. (Revised formatting and fonts March 20
Subjects:
Grades:
9th - 12th
Types:
Also included in: Psychology Research Design *UNIT BUNDLE*
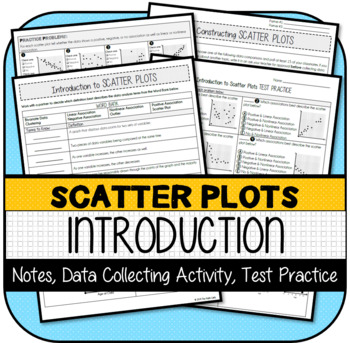
Introduction to Scatter Plots NOTES & PRACTICE
This resource contains the following items:1) Introduction to Scatter Plots NOTES & PRACTICE· Understanding Terms· Understanding Positive, Negative, Linear, Nonlinear Associations2) Constructing a Scatter Plot DATA COLLECTING MINI-PROJECT (Optional)· If you have time for a chaotic day of data collecting, students have fun choosing the data to collect!· Recommended: Have them display results on a poster to share with the class the next day3) Introduction to Scatter Plots TEST PRACTICE -8
Subjects:
Grades:
7th - 9th
Types:
CCSS:
Also included in: Scatter Plots MINI-BUNDLE
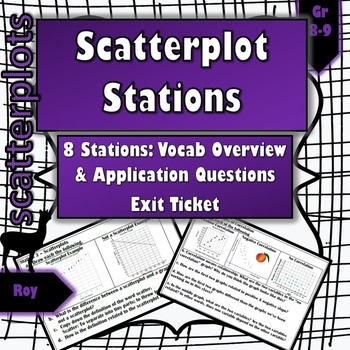
Scatterplot Stations + Exit Ticket
These 8 stations are designed to either introduce or review all the vocabulary related to scatterplots including linear vs non-linear, positive, negative, and no correlation, best fit line, outlier, and so on. The stations are designed for 5 - 8 minute rotations depending on the level of your class. There are a ton of application questions that help teach and remediate the skills require to access scatterplots.Since there are 8 stations, folding a blank piece of paper into 8 sections will allow
Subjects:
Grades:
8th - 9th
Types:
Also included in: Scatterplots Bundle (Weeks of Products!)
Showing 1-24 of 750 results


