147 results
High school statistics interactive notebooks $5-10
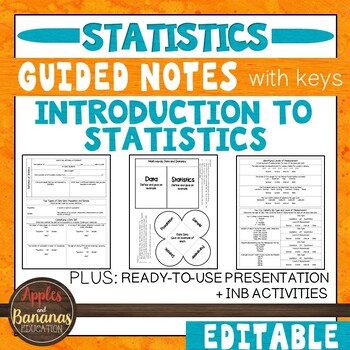
Introduction to Statistics - Guided Notes, Presentation, and INB Activities
This Introduction to Statistics product is flexible, editable, and can be used for in-person or distance learning. Take the time and stress out of creating your own guided notes and presentations. There are many ways to use this engaging bundle. It includes guided notes embedded with student practice problems (keys included), foldable activities, and a PowerPoint presentation for focused instruction. Choose what works best for your class/student and modify to make the content fit your needs. Not
Subjects:
Grades:
9th - 12th
CCSS:
Also included in: Custom Bundle for Viet
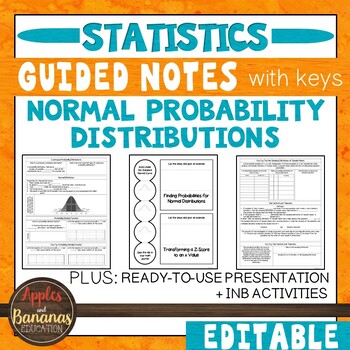
Normal Probability Distributions - Guided Notes, Presentation, + INB Activities
This Normal Probability Distributions (Statistics) product is flexible, editable, and can be used for in-person or distance learning. It includes guided notes embedded with student practice problems (keys included), foldable activities, and a PowerPoint presentation for focused instruction. Choose what works best for your class/student and modify to make the content fit your needs. Notes are designed to clearly present the topics and reach all types of learners. Take the time and stress out of c
Subjects:
Grades:
9th - 12th
CCSS:
Also included in: Custom Bundle for Viet
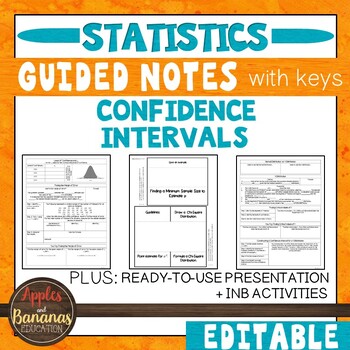
Confidence Intervals - Statistics Guided Notes, Presentation, +INB Activities
This Confidence Intervals (Statistics) product is flexible, editable, and can be used for in-person or distance learning. It includes guided notes embedded with student practice problems (keys included), foldable activities, and a PowerPoint presentation for focused instruction. Choose what works best for your class/student and modify to make the content fit your needs. Notes are designed to clearly present the topics and reach all types of learners. Take the time and stress out of creating your
Subjects:
Grades:
9th - 12th
CCSS:
Also included in: Custom Bundle for Viet
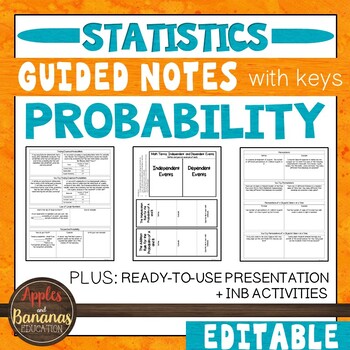
Probability - Guided Notes, Presentation, and Interactive Notebook Activities
This Probability (Statistics) product is flexible, editable, and can be used for in-person or distance learning. It includes guided notes embedded with student practice problems (keys included), foldable activities, and a PowerPoint presentation for focused instruction. Choose what works best for your class/student and modify to make the content fit your needs. Notes are designed to clearly present the topics and reach all types of learners. Take the time and stress out of creating your own guid
Subjects:
Grades:
9th - 12th
CCSS:
Also included in: Custom Bundle for Viet
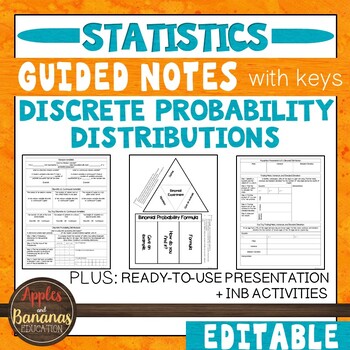
Discrete Probability Distributions - Notes, Presentation, and INB Activities
This Discrete Probability Distributions (Statistics) product is flexible, editable, and can be used for in-person or distance learning. It includes guided notes embedded with student practice problems (keys included), foldable activities, and a PowerPoint presentation for focused instruction. Choose what works best for your class/student and modify to make the content fit your needs. Notes are designed to clearly present the topics and reach all types of learners. Take the time and stress out of
Subjects:
Grades:
9th - 12th
CCSS:
Also included in: Custom Bundle for Viet
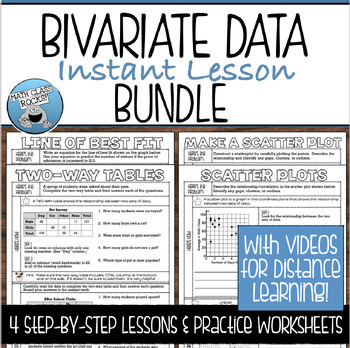
BIVARIATE DATA GUIDED NOTES AND PRACTICE BUNDLE
Save time and make your life easy with this set of BIVARIATE DATA GUIDED NOTES and PRACTICE WORKSHEETS! Perfect for introducing a new concept, reviewing a previously learned skill, or your interactive notebook! These guided notes will simplify every lesson with step-by-step examples and practice problems to provide a year-long resource for your students to refer to again and again!This lesson is included in my Linear Equations Instant Lesson BUNDLE. Click HERE to view this resource and SAVE 25%!
Subjects:
Grades:
7th - 9th
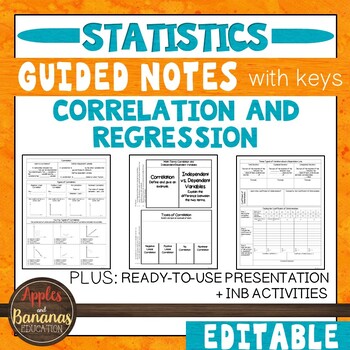
Correlation and Regression - Guided Notes, Presentation, and INB Activities
This Correlation and Regression (Statistics) product is flexible, editable, and can be used for in-person or distance learning. It includes guided notes embedded with student practice problems (keys included), foldable activities, and a PowerPoint presentation for focused instruction. Choose what works best for your class/student and modify to make the content fit your needs. Notes are designed to clearly present the topics and reach all types of learners. Take the time and stress out of creatin
Subjects:
Grades:
9th - 12th
CCSS:
Also included in: Custom Bundle for Viet
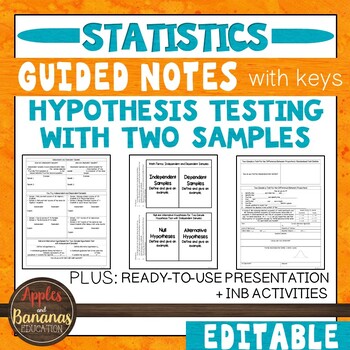
Hypothesis Testing with Two Samples - Guided Notes, Presentation, INB Activities
This Hypothesis Testing with Two Samples (Statistics) product is flexible, editable, and can be used for in-person or distance learning. It includes guided notes embedded with student practice problems (keys included), foldable activities, and a PowerPoint presentation for focused instruction. Choose what works best for your class/student and modify to make the content fit your needs. Notes are designed to clearly present the topics and reach all types of learners. Take the time and stress out o
Subjects:
Grades:
9th - 12th
CCSS:
Also included in: Custom Bundle for Viet
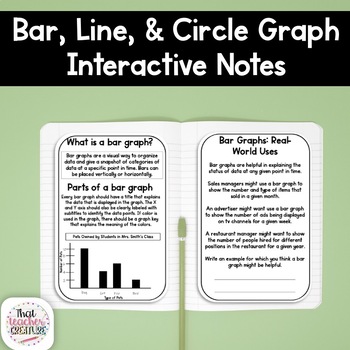
Bar, Line, and Circle Graph Interactive Notes
Make teaching bar, line, and circle graphs easier with these interactive notes! This no-prep set includes 3 sets of interactive notes perfect for exploring types of graphs. Quick and easy setup helps save you time and provides students with notes they need to understand the purpose, parts, and real-world uses of each type of graph. Here's what you'll get:purpose of a bar, line, and circle graphparts of a bar, line and circle graphreal world application of each type of graphguided practice - crea
Subjects:
Grades:
4th - 12th
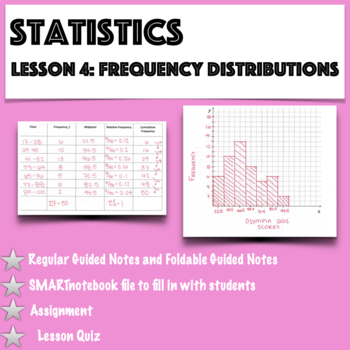
Statistics - Lesson 4: Frequency Distributions and their Graphs
This is the 4th lesson for an introductory statistics course and 1 of 5 lessons in this unit.Students will: -Be introduced to key vocabulary -Create a frequency distribution -Make a histogram, a frequency polygon, and an ogiveThere is another version of this lesson that comes with a video (see my store).In addition to guided notes (foldable or regular guided notes), the following is included: -SMARTnotebook file for the teacher to fill in with the students -Assignment to
Subjects:
Grades:
9th - 12th, Higher Education
Also included in: Statistics- Unit 2 Bundle: Describing Statistics
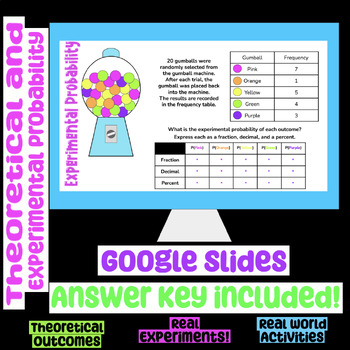
Theoretical and Experimental Probability Google Slides Digital Notes
Students learn how to calculate theoretical and experimental probability.Includes formulas and several examples of theoretical and experimental probability including dice, playing cards, and a real working spinner!Includes guided notes and drag and drop activities! Would make a great introduction or review in any math classroom! Would make a great addition to a digital interactive notebook! Answer key included. Digital learning friendly!
Subjects:
Grades:
6th - 9th
AP Statistics - Confidence Intervals: An Introduction
Students will: -use the point estimate to create a confidence interval -calculate the point estimate and margin of error given an interval -interpret a confidence interval and level. -be introduced to critical valuesIn addition to the guided notes (foldable book notes or regular guided notes), the following is included:SMARTnotebook file for the teacher to fill in with the studentsHomework/ClassworkThese lessons are set up to have the teacher lead the students through the note-t
Subjects:
Grades:
9th - 12th, Higher Education

Normal Distribution Foldable Popup
This is a popup of a normal distribution graph, showing students the probable spread of data within 1, 2, 3, and 4 standard deviations of the mean. The formulas for the population standard deviation and the sample standard deviation are both included. It is a great reference/graphic organizer for student notebooks and I have even had students who weren't in my class ask to join because they wanted this popup too. Useful for math or maths class, great for visual and kinesthetic learners, and
Subjects:
Grades:
9th - 12th, Higher Education, Adult Education
CCSS:
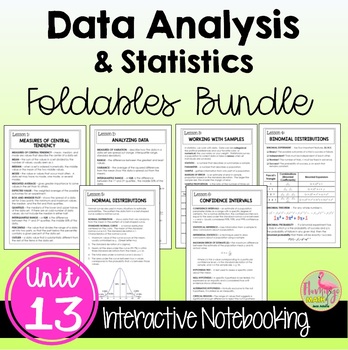
Data Analysis and Statistics FOLDABLES™ (Algebra 2 - Unit 13)
This bundle of 8-page Bound-Book-Style Foldables includes six lessons on topics in UNIT 13: Data Analysis & Statistics for your Algebra 2 Honors students. A set of finished notes and directions for creating the Foldables are also included.⭐ Bonus: A set of Google Slides for presenting the lesson and video lesson links are now included for distance learning and flipped classroom methods.☆FOLDABLESThree options of an 8-page Bound-Book Foldable® will help with differentiation.Option #1: All voc
Subjects:
Grades:
8th - 11th, Higher Education
CCSS:
Also included in: Algebra 2 Curriculum Big Bundle | Flamingo Math
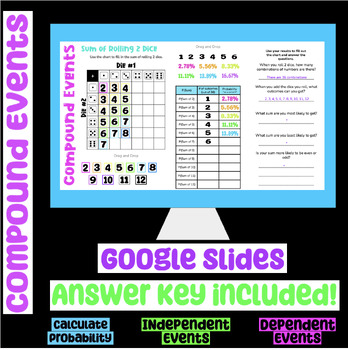
Calculating Probability of Compound Events Google Slides Digital Notes/Activity
Students learn how to calculate probability of independent and dependent compound events.Includes formulas and several examples of calculating probability of compound independent and dependent events. Includes calculations using sum of 2 dice, a gumball machine, playing cards, and a spinner!Includes guided notes and drag and drop activities! Would make a great introduction or review in any math classroom! Would make a great addition to a digital interactive notebook! Answer key included. Di
Subjects:
Grades:
6th - 9th
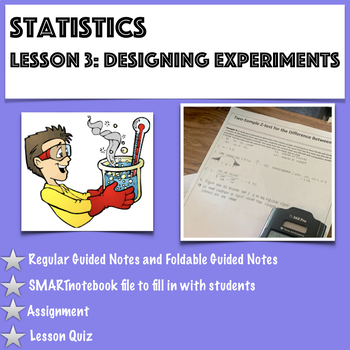
Statistics - Lesson 3: Designing an Experiment
This is lesson 3 of Unit 1. Updated 8-23-19If you are interested in purchasing the whole curriculum, visit my store. I sell the whole curriculum with videos of the lessons and without videos. In this lesson students will: -Be exposed to the different statistical studies -Learn how data is collected by doing observational studies, experiments, simulations, or surveys -Learn how experiments are designed -Know how to sample by using random sampling techni
Subjects:
Grades:
9th - 12th, Higher Education
Also included in: Statistics-Unit 1 Bundle: Introduction to Statistics
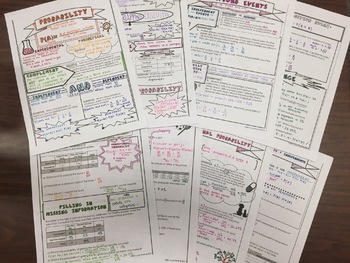
Interactive Probability Notes
This bundle includes 4 different interactive notes for: overall probability vocab, compound events, probability models, and conditional probability. Also included are two "cheat sheets" for students to have in interactive notebooks: one for probability symbols and one for the basics of a deck of cards.
Subjects:
Grades:
9th - 12th
CCSS:
AP Statistics - Significance Tests for Proportions
In these guided notes and homework students will: -Set up the hypotheses for a claim -Calculate the test statistic Z -Calculate p-values -Determine if p-values are unusual -Run a significance test on population proportionsIn addition to the guided notes (foldable book notes or regular guided notes), the following is included:SMARTnotebook file for the teacher to fill in with the studentsHomework/ClassworkQuizAn updated version of the lesson has been added on 4-13-2021.These l
Subjects:
Grades:
9th - 12th, Higher Education
AP Statistics - Two Variable Statistics Part 3: Least-Squares Regression
This is the twelfth lesson, in a series of 14 lessons, in the Descriptive Statistics Unit for AP Statistics.
Students will:
-Find and interpret the slope and y-intercept of a least-squares regression line
-Use the LSRL to predict y for a given x
-Find and interpret residuals
-Find the LSRL with technology
In addition to the guided notes (foldable book notes or regular guided notes), the following is included:
SMARTnotebook file for the teacher to fill in with the students
Ho
Subjects:
Grades:
9th - 12th
Also included in: AP Statistics- Chapter 4 Bundle: Correlation and Regression
AP Statistics - Two Variable Statistics Part 2: Correlation and Scatterplots
This is the eleventh lesson in a series of 14 lessons in the Descriptive Statistics Unit for AP Statistics.
Students will:
-Be able to identify outliers in a scatterplot
-Estimate the strength of relationships using a scatterplot
-Use technology to calculate the correlation coefficient
-Know the key facts about correlation
In addition to the guided notes (foldable book notes or regular guided notes), the following is included:
SMARTnotebook file for the teacher to fill in
Subjects:
Grades:
9th - 12th
Also included in: AP Statistics- Chapter 4 Bundle: Correlation and Regression
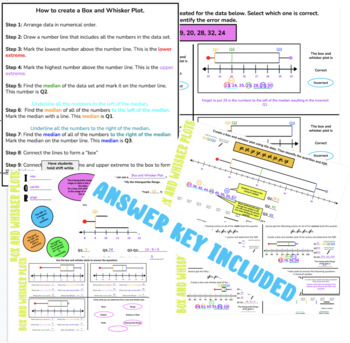
Box and Whisker Plots, Quartiles, and IQR Google Slides
Students learn how to create box and whisker plots as well as identify quartiles and IQR. Includes color coded steps for creation with drag and drop parts, several examples to create, word problems, and answering questions based on a box and whisker plot. Also includes a slide of identifying what is wrong with the creation of a box and whisker plots designed for advanced learners! Includes guided notes and practice problems! Would make a great introduction or review in any math classroom! Wou
Subjects:
Grades:
6th - 10th
AP Statistics - Sampling Distributions for Sample Means
This is the twelfth lesson in the Probability Unit for AP Statistics and the last lesson in a series of three lesson covering sampling distributions.Students will: -Calculate the mean and standard deviation of a sampling distribution of means -Explore how sample size affects the shape and variability of a sampling distribution of means -Use normal approximation to calculate probabilitiesIn addition to the guided notes (foldable book notes or regular guided notes), the following
Subjects:
Grades:
9th - 12th, Higher Education
Also included in: AP Statistics-Chapter 7 Bundle: Sampling Distributions
AP Statistics-Discrete and Continuous Random Variables:Probability Distributions
This is the fifth lesson in the Probability Unit for AP Statistics and the first lesson in a series of five lessons covering random variables.Students will: -Calculate probabilities using a probability distribution -Calculate the mean of a discrete random variable and interpret it in context -Calculate the standard deviation of a discrete random variable and interpret it in context -Graphically display a probability model -Use normal approximation to calculate probabili
Subjects:
Grades:
9th - 12th, Higher Education
Also included in: AP Statistics-Chapter 6 Bundle:Random Variables
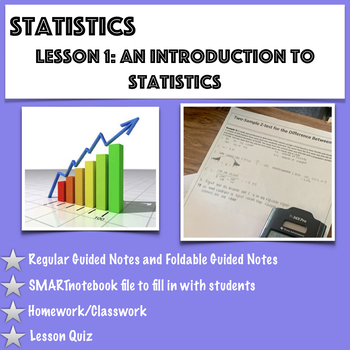
Statistics - Lesson 1: Introduction to Statistics
Updated 8-17-19This is the first lesson for an introductory statstics course and 1 of 3 lessons in this chapter.Students will: -Be introduced to key vocabulary -Distinguish between a population and a sample -Distinguish between a parameter and a sample -Distinguish between descriptive statistics and inferential statisticsIn addition to the guided notes (foldable book notes or regular guided notes), the following is included:SMARTnotebook file for the teacher to fill in with the s
Subjects:
Grades:
10th - 12th, Higher Education
Also included in: Statistics-Unit 1 Bundle: Introduction to Statistics
Showing 1-24 of 147 results


