588 results
Statistics lessons $5-10
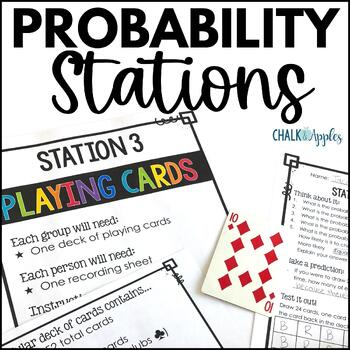
Chance & Probability Activities: Hands-On Theoretical & Experimental Probability
Make teaching probability exciting with these hands-on fun probability activities! This set includes 6 low-prep chance and probability stations perfect for exploring theoretical and experimental probability and critical thinking. Quick and easy setup plus clear student directions make these activities perfect for centers or substitute days, too!Lead your students to discover concepts of probability by exploring it on their own before teaching probability rules. Students will love exploring proba
Subjects:
Grades:
5th - 7th
Types:
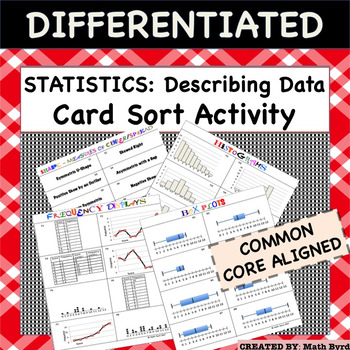
Statistics:Representing & Interpreting Data (Histogram, Box Plot, Dot Plot)
Complete Lesson! This lesson features a 40 CARD SORT, Differentiated Cornell Notes, Distribution Shapes Graphic Organizer, and Power Point to go with the notes! Perfect for the inclusive classroom! Within the Card Sort Activity there are 5 categories of cards to match: 1) Histogram2) Frequency Display (including Dot Plots, Frequency Line Graphs and Tables)3) Box Plots4) Describing Shape5) Describing Measures of Center & Spread. With 8 different sets of matches, there are 40 cards total. Stud
Subjects:
Grades:
8th - 12th
Types:
CCSS:
Also included in: Common Core Algebra 1 CARD SORT ACTIVITIES - BUNDLE PRICE!
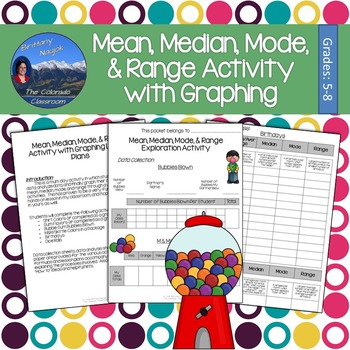
Mean Median Mode and Range Exploration Lab & Graphing Activity
Mean, median, mode, and range are explored in this activity lesson pack complete with lesson plans, student packets, and graphing pages. You and your students will tackle these four important measures of central tendency through a fun lab activity involving bubble gum, M&Ms, birthdays, dice, and more. Students will collect data, analyze their data, and then graph their results all while learning about the mean, median, mode, and range of various scenarios.This activity is prepared and read
Subjects:
Grades:
5th - 8th
Types:
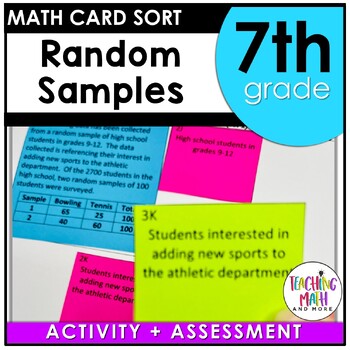
Random Samples & Populations Card Sort Activity Lesson
This lesson unit is intended to help you assess how well students are able to understand that statistics can be used to gain information about a population by examining a sample of the population; generalizations about a population from a sample are valid only if the sample is representative of that population. Understand that random sampling tends to produce representative samples and support valid inferences. Use data from a random sample to draw inferences about a population with an unknown c
Subjects:
Grades:
7th
Types:
Also included in: Math Card Sort Activity Grade 7 BUNDLE
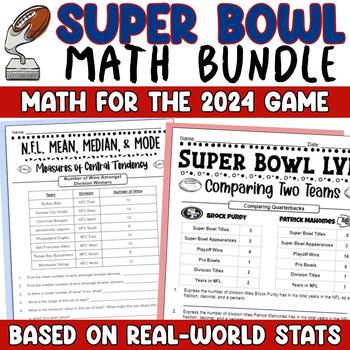
Super Bowl Math Activities Bundle 2023 - NFL Stats Math and Super Bowl Teams
These Super Bowl Math activities for 2023 are perfect to cheer on the Chiefs or the Eagles! Your football fans will love comparing the two teams to determine a winner, and finding the measures of central tendency for real NFL stats from the 2022 season.In Super Bowl Math: Comparing Two Teams, students pit the Eagles and Chiefs against one another to predict a winner. They analyze real-world statistics from this season, including offensive statistics, defensive stats, quarterback experience, an
Subjects:
Grades:
6th - 8th
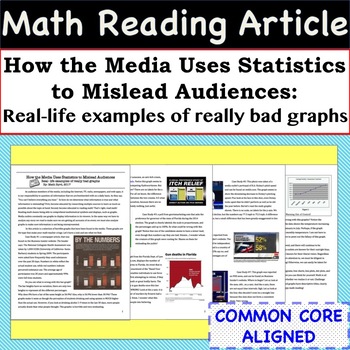
Statistics Math Article - Case Studies of Bad Graphs found in the Media
Incorporate Reading & Writing into the Math Classroom with this article and accompanying worksheet! The 4 page article is entitled - "How the Media Uses Statistics to Mislead Audiences: Real- life examples of really bad graphs". The worksheet helps students summarize the case studies and the article as a whole. This resource can be used in so many ways, some ideas are: station activity, independent reading assignment, small group activity, homework assignment, or whole class discussion.Skill
Subjects:
Grades:
8th - 11th
CCSS:
Also included in: Common Core Algebra 1 MATH READING ARTICLES - BUNDLE PRICE!
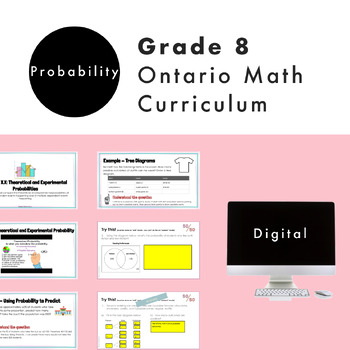
Grade 8 Ontario Math Probability Digital Google Slides + Form
Do you need a practical and engaging resource for the NEW Ontario Math Number strand? Are you planning for the NEW Grade 8 Ontario Math Curriculum? This editable Google Slide resource is what you need! This resource is for the Grade 8 DATA strand and covers specific expectations for “D2 Probability". In this resource, students will experience math through engaging real-life questions, storytelling through math, and interactive slides. What’s Included2 Google Slide presentations67 UNIQUE and ED
Subjects:
Grades:
7th - 9th
Types:
Also included in: Grade 8 NEW Ontario Math Curriculum Full Year Digital Slides Bundle
Food Waste and Mathematics: From Farm to Table to Dump
Here's a very uncomfortable fact: it takes 4 pounds of potatoes to make 1 pound of potato chips. That means that for every 1 pound bag of potato chips you eat, 3 pounds of potatoes have to be thrown away. What a waste of food! This is a series of activities that looks at the hidden world of food waste. It includes a look at how much food is wasted as it is "processed" into finished products like french fries and potato chips. It also includes mathematical activities where students calculate how
Subjects:
Grades:
5th - 12th, Adult Education
Types:
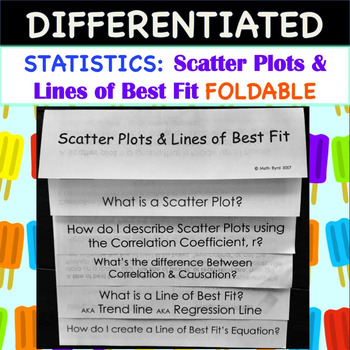
Statistics:Scatter Plots and Lines of Best Fit FOLDABLE
So Easy to Use! Simply print and fold! No need to rotate pages! Scatter Plots and Lines of Best Fit FOLDABLE also includes a PowerPoint to go along with the foldable.Foldable has 2 tiers of differentiation, perfect for the inclusive classroom! 1 set has fill-in-the-blank style notes within the foldable, while the other foldable has the notes already filled in. On both sets, students will have to work out the examples.Students will learn how to: Create Scatter PlotsDescribe Scatter Plots using Co
Subjects:
Grades:
8th - 11th
CCSS:
Also included in: Common Core Algebra 1: STATISTICS UNIT - BUNDLE PRICE!
Statistics & Probability Common Core Unit {grade 8}
Statistics and Probability unit for grade 8 includes: interactive notebook pages, enter/exit tickets, task cards, activities, worksheets and assessments to teach the following 8th grade math standards:
8.SP.1 - Scatter plots
8.SP.2 - Trend lines
8.SP.3 - Interpreting linear models
8.SP.4 - Two-way tables and Relative-frequency tables
Use the interactive notebook pages as inspiration for how to organize your class's INB. Notes are included with each INB page to give tips and tricks for using th
Subjects:
Grades:
8th
Types:
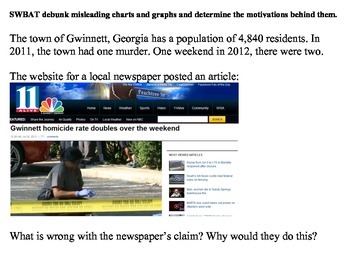
Misleading Charts and Graphs (Statistics)
Teaching students to deduce information provided in charts and graphs is an essential part of any math curriculum.
However, what do you do when the graph itself provides misleading or false information?
This lesson is a good way to get students to look critically at graphically displayed data and see through those who try to manipulate data for their own purposes.
Subjects:
Grades:
7th - 12th, Higher Education, Adult Education
Types:
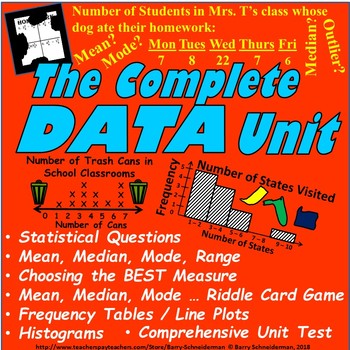
Mean, Median, Mode, Range, Line Plot, Histogram & More Data and Statistics Unit
Mean, median, mode, range, frequency tables, line plots, histograms, statistical questions, determination of the best measure of center, discussion of the impact of outliers .. real-world data and statistics concepts that we often find we are attempting to cram into our curriculum at the end of the school year. This complete data unit, which can be used at any time throughout the year, was created to help reduce this anxiety! In six to eight days, it comprehensively and, using an enjoyable, ea
Subjects:
Grades:
5th - 8th
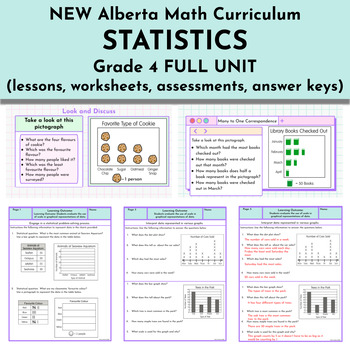
Statistics Unit - NEW Alberta Math Curriculum Grade 4
This Grade 4 Statistics resource is intended to meet the NEW 2023 Alberta Math curriculum expectations. Learning Outcome: Students evaluate the use of scale in graphical representations of data.Skills and Procedures:Engage in a statistical problem-solving process.Select an appropriate scale to represent data.Represent data in a graph using many-to-one correspondence.Describe the effect of scale on representation.Justify the choice of graph used to represent certain data.Compare different graphs
Subjects:
Grades:
4th
Types:
Also included in: FULL YEAR Alberta Math Curriculum - Grade 4
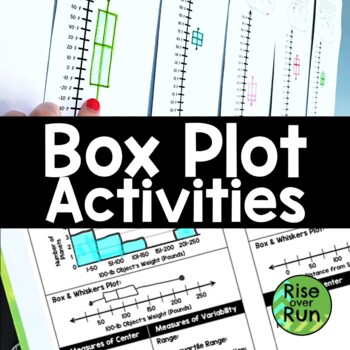
Box & Whisker Plots Activities and Lessons
No more boring box plot lessons! These activities are engaging and will help your students see how box plots are really useful with real world data. Grab these 5 resources, print, and be ready to go! Here are the resources included in this bundle:Box & Whiskers Real World Temperature LessonIn this fun activity, students use data about temperatures in a city to create a vertical box & whiskers plot. Then they compare with classmates' cities and discuss what they notice!Statistics Cheat
Subjects:
Grades:
6th - 7th
Types:
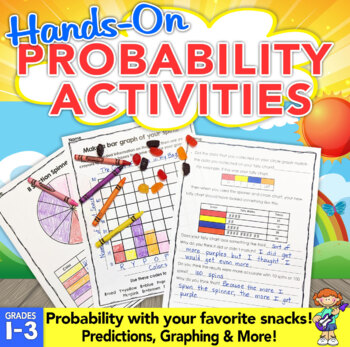
Probability Activities: Hands-On Probability with Snacks!
Probability activities are fun and engaging when you add treats! These fun probability activities allow students to experiment with probability using snacks.Students will use probability to predict, investigate, record data, and learn to use words to describe the chances of something happening.Students will love these probability activities because they are using skills with snacks! Each of the probability activities builds on each other and guides them step-by-step. Easy prep to print off the p
Subjects:
Grades:
1st - 3rd
Types:
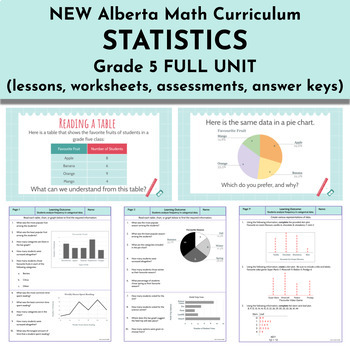
Statistics Unit - NEW Alberta Math Curriculum Grade 5
This Grade 5 Statistics resource is intended to meet the NEW 2023 Alberta Math curriculum expectations. Learning Outcome: Students analyze frequency in categorical data.Skills and Procedures:Examine categorized data in tables and graphs.Determine frequency for each category of a set of data by counting individual data points.Identify the mode in various representations of data.Recognize data sets with no mode, one mode, or multiple modes.Justify possible answers to a statistical question using m
Subjects:
Grades:
5th
Types:
Also included in: FULL YEAR Alberta Math Curriculum - Grade 5
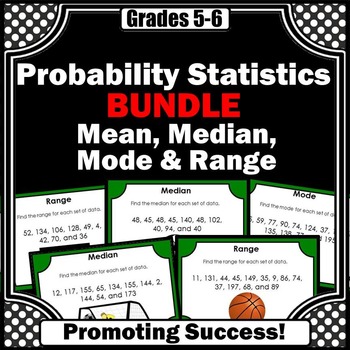
Mean Median Mode Range Task Cards BUNDLE Measures of Central Tendency Games
DIGITAL PDF AND PRINTABLE PACKET: In this bundle, you will download 120 (4 sets) mean, median, mode and range task cards for your 6th grade, 7th grade, and special education math students to practice measures of central tendency. You may use the printable task cards in math centers or stations for fun practice and review games and activities, such as a scavenger hunt or SCOOT. They also work well for transition activities, as exit tickets, for morning work, and as quick formative assessments. G
Subjects:
Grades:
5th - 7th
CCSS:
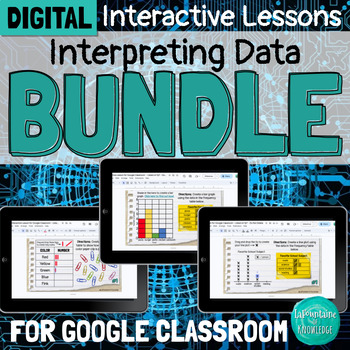
DIGITAL Interpreting Data Interactive Lesson Bundle for Google Classroom
This bundle of 3 digital interactive math lessons for Google Classroom teaches interpreting categorical and numerical data using frequency tables, bar graphs, and line plots. Each lesson includes: a video lesson (YouTube and Loom viewing options included) practice problems and activitiesteacher directions and answer keysThese lessons are ready to assign and easy for students to complete independently. Students will learn:important vocabulary - title, categories, tally marks, key, categorical dat
Subjects:
Grades:
3rd - 5th
Types:
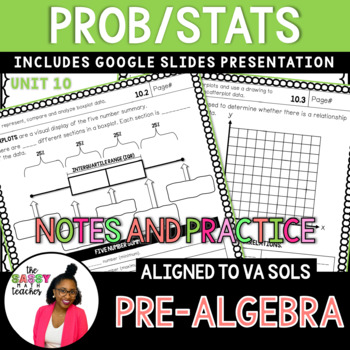
8th Grade Statistics and Probability Notes - 2016 Va Math SOLs
This 8th Grade Statistics and Probability Notes bundle is a great way to introduce your students to compound probability, boxplots and scatterplots.⭐️⭐️Full Year of 8th Grade Math Guided Notes⭐️⭐️⭐️⭐️⭐️FREE 8th Grade Math Pacing Guide⭐️⭐️⭐️Your 8th-graders will learn to distinguish between independent and dependent events along with interpreting and creating boxplots and scatterplots.The notes are perfect for binders!PLUS: At the top of each page, you will find the learning objective and space f
Subjects:
Grades:
7th - 9th
Types:
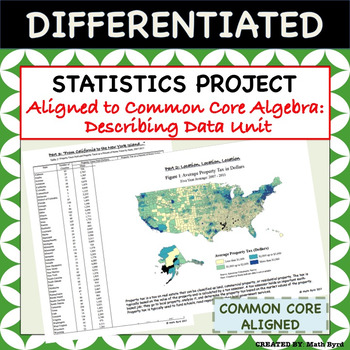
Statistics Project - Aligned to Common Core Algebra - Describing Data Unit
This differentiated U.S. Home Energy & Tax Themed Statistics Project covers all of the "describing data" standards of the Common Core Algebra Course using real data! Students will analyze various forms of tables & graphics to make inferences and interpret the data. The project is perfect for use as a summative assessment since students are required to justify their findings in open-ended format. Allow students to work in pairs, small groups, or individually! A grading rubric and selected
Subjects:
Grades:
8th - 11th
Types:
CCSS:
Also included in: Common Core Algebra 1 PROJECTS - BUNDLE PRICE!
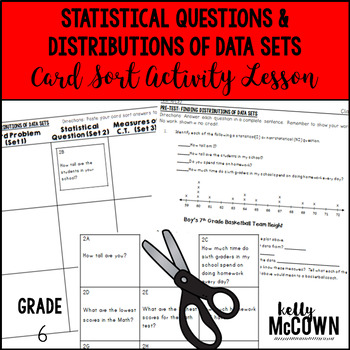
Statistical Questions & Distributions of Data Sets Card Sort Activity Lesson
This lesson unit is intended to help you assess how well students are able to recognize a statistical question as one that anticipates variability in the data related to the question and accounts for it in the answers. Understand that a set of data collected to answer a statistical question has a distribution which can be described by its center, spread, and overall shape.
Included in this lesson are:
-One formative assessment (pre-test) tasks
-Card sort activity with concept development o
Subjects:
Grades:
6th
Types:
Also included in: Math Card Sort Activity Grade 6 BUNDLE
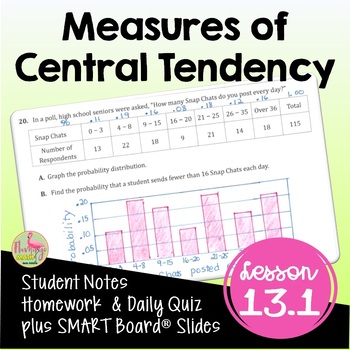
Measures of Central Tendency (Algebra 2 - Unit 13)
Measures of Central Tendency Algebra 2 Lesson:Your Pre-AP Algebra 2 Honors students will draw, analyze and interpret box-and-whisker plots, find outliers, and calculate measures of central tendency in this unit 13 lesson on Data Analysis & Statistics that cover the concepts in depth. #distancelearningtptWhat is included in this resource?⭐ Guided Student Notes⭐ Google Slides®⭐ Fully-editable SMART Board® Slides⭐ Homework/Practice assignment⭐ Lesson Warm-Up (or exit ticket)⭐Daily Content Quiz
Subjects:
Grades:
8th - 11th, Higher Education
CCSS:
Also included in: Algebra 2 Curriculum Mega Bundle | Flamingo Math
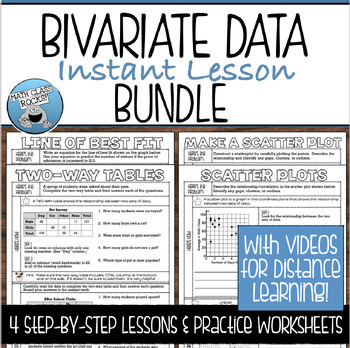
BIVARIATE DATA GUIDED NOTES AND PRACTICE BUNDLE
Save time and make your life easy with this set of BIVARIATE DATA GUIDED NOTES and PRACTICE WORKSHEETS! Perfect for introducing a new concept, reviewing a previously learned skill, or your interactive notebook! These guided notes will simplify every lesson with step-by-step examples and practice problems to provide a year-long resource for your students to refer to again and again!This lesson is included in my Linear Equations Instant Lesson BUNDLE. Click HERE to view this resource and SAVE 25%!
Subjects:
Grades:
7th - 9th
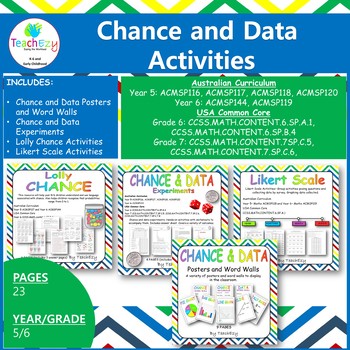
Chance and Data Bundle
1. Likert Scale Activity⭐ Engaging activity for the classroom. Likert Scale Activities– Group activities posing questions and collecting data by survey, followed by graphing data collected.→ 5 pagesAustralian CurriculumYear 5– Maths ACMSP118 and Year 6– Maths ACMSP119USA Common CoreCCSS.MATH.CONTENT.6.SP.A.12. Chance and Data Lollies⭐ This resource will help Year 5 /6 children understand and use language associated with chance. Also helps children recognise that probabilities range from 0 to 1.→
Subjects:
Grades:
5th - 7th
Types:
Showing 1-24 of 588 results


