49 results
High school statistics centers $5-10
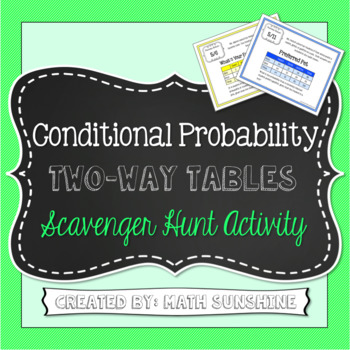
Conditional Probability Two-Way Frequency Tables Scavenger Hunt Activity
Conditional Probability Two-Way Frequency Tables Scavenger Hunt Activity
During this activity, students travel around the room answering conditional probability questions involving two-way frequency tables.
This activity is a great opportunity to group students or let students work with a partner. Students begin by starting at a random station. After a student has found the answer to a station, he will visit the next station using the answer he found. Students continue to move at their own pa
Subjects:
Grades:
6th - 12th
Types:
CCSS:
Data Analysis and Statistics in Algebra 1 Google Forms Homework and Assessment
This Algebra 1 Google Forms bundle currently includes auto-grading assignments on the following skills related to data analysis and statistics:Measures of Central TendencyDot Plots and HistogramsBox PlotsStandard Deviation and The Empirical RuleTwo-Way Frequency TablesScatter PlotsEach assignment also includes a PDF "worksheet" for students to complete along with the form.All of the assignments in this bundle are also included in my:★ Algebra 1 (Semester 2) Google Forms BundleYou may also be int
Subjects:
Grades:
6th - 9th
CCSS:
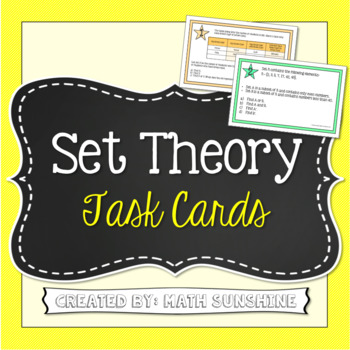
Set Theory with Venn Diagrams Task Cards Activity (And, Or, and Complement)
Set Theory Task Cards (Using And, Or, and Complement)
These 10 task cards are a fun way for students to practice identifying sets using AND, OR, and COMPLEMENT.
The task cards present sets in a variety of ways. Some cards include lists of numbers, while others include tables or lists of names. For each card, students must create a Venn diagram and answer 1 to 4 questions about the set. The cards get increasingly more difficult as students progress through the 10 cards.
These are the types o
Subjects:
Grades:
6th - 12th
Types:
CCSS:
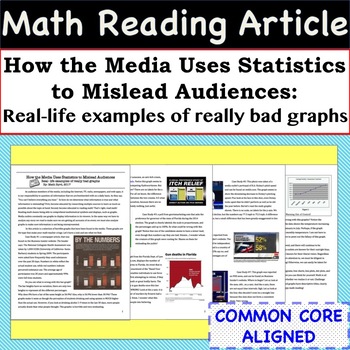
Statistics Math Article - Case Studies of Bad Graphs found in the Media
Incorporate Reading & Writing into the Math Classroom with this article and accompanying worksheet! The 4 page article is entitled - "How the Media Uses Statistics to Mislead Audiences: Real- life examples of really bad graphs". The worksheet helps students summarize the case studies and the article as a whole. This resource can be used in so many ways, some ideas are: station activity, independent reading assignment, small group activity, homework assignment, or whole class discussion.Skill
Subjects:
Grades:
8th - 11th
CCSS:
Also included in: Common Core Algebra 1 MATH READING ARTICLES - BUNDLE PRICE!
Math Review Packet - 7th Grade - with QR Codes! NO PREP! Common Core Aligned
This 7th grade math review packet is perfect for your students to work on independently! It is great for either the end of the 7th grade or the beginning of 8th.
The packet consists of 12 sections that address multiple math standards including fractions, decimals, integers, circles, probability, and angles! In each section, there are QR codes that the students can scan which will link them to an image that has more examples and explanations to help them solve the problems. There are also QR cod
Subjects:
Grades:
7th - 9th
Types:
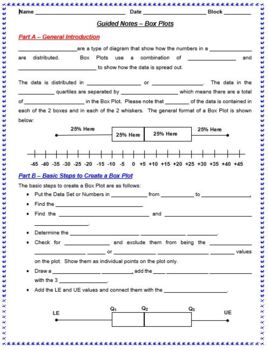
Guided Notes - Statistics Bundle (Box, Line & Scatter Plots, Histograms, Etc.)
This MS Word file is a bundle of 6 separate Guided Notes documents that review both the concept and steps involved in various statistical measures, plots and diagrams. The following Guided Notes documents are included in this bundle:Box PlotsLine PlotsHistogramsMeasures of Central TendencyScatterplots and Line of Best FitScatterplots and CorrelationThese individual Guided Notes documents have been bundled together to provide teachers with a single, complete, discounted package of 6 of the basic
Subjects:
Grades:
8th - 11th
CCSS:
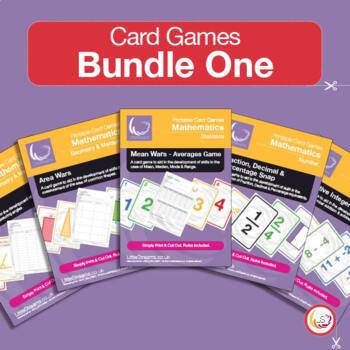
Fractions, Averages, Area, Angles, Negative Numbers - 5 Card Games Bundle 1
Card game bundle 1This pack contains FIVE different printable card games at discount. High quality, professionally designed pages of learning material put together by a successful Home Tutor and professional graphic designer.The pack contains the following games:• Angles | Card Game for learning basic acute and obtuse angles• Area of Shapes | Card Game for learning how to measure the area of shapes• Fractions, Decimals & Percentages Snap | Card Game for learning equivalent values• Negative I
Subjects:
Grades:
4th - 9th
Data Analysis Statistics and Probability worksheets (63 Problems) (SAT Review)
Data analysis statistics and probability worksheets ,63 problemsSAT ReviewFraction and Data (29 Multiple choice questions)Statistic Problem (15 questions)Probability Word Problems This section contains 19 word problems about :Simple ProbabilityCounting PrincipleIndependent ProbabilityDependent ProbabilityMutually Exclusive EventsPermutationsCombinationsConditional Probability* AlSO AVAILABLE FOR YOU OR A COLLEAGUE! - CLICK ANY LINK YOU WANT:Number and Operations (SAT Review) Algebra & Functi
Subjects:
Grades:
7th - 12th, Higher Education, Adult Education, Staff
Types:
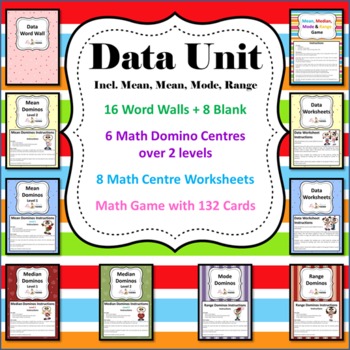
Data Unit - 6 Math Center/Literacy/ 8 Worksheets, Game & Wordwall
This very engaging, colourful and multilevel data unit is waiting for you to just print, laminate and you're ready to roll! All activities are able to be used as worksheets instead of Math Centre activities and vice versa!
Easy to read instructions and answer keys provided for all activities.
See thumbnails and preview for more detailed information due to the number of activities included.
Probability Word Wall contains 16 probability word walls with 8 blanks for your little ones to add you
Subjects:
Grades:
4th - 9th
Types:
Counting Principle & Permutation Task Cards (Digital/PDF)
This download includes both a PDF and digital Google Forms version of this activity.Do you need more questions to use to provide practice with the counting principle and/or permutations? Here you go!These 36 task cards focus on using the counting principle and calculating permutations. Both color and black/white copies are included. Copy them onto cardstock and/or laminate them to create a long-lasting, reusable resource. Use a few at a time for focused practice or mix them together … your c
Subjects:
Grades:
7th - 12th
Types:
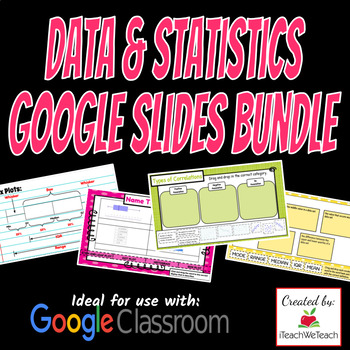
Statistics Bundle | Google Slides Activities | Download & Go!
The bundle includes:Measures of Center and Spread Google Slides ActivityCreating and Interpreting Box Plots Google Slides ActivityDisplaying Data Google Slides ActivityScatter Plots Google Slides ActivityTopics Include: mean, median, mode, range, maximum, minimum, measures of center, measures of spread, dot plots, box-and-whisker plots, histograms, and more.These activities are ideal for use with Google Classroom, but can be shared as a link on virtual classroom websites like Canvas, Schoology,
Subjects:
Grades:
6th - 9th
Types:
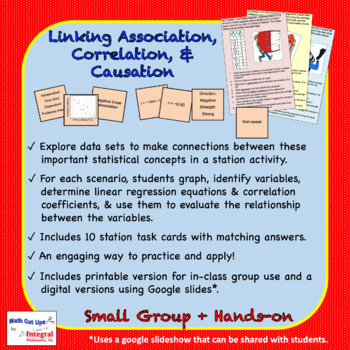
Linking Association, Causation, and Correlation
In this hands-on activity for small groups, students work together to identify the variables in a real-world scenario. Then they match the scatterplot, the type of association (positive/negative/none), the regression equation, the correlation coefficient, the strength and the direction of correlation together and determine whether the situation is causal or not. reinforces so many skills!10 task card scenarios and matching cards included. This activity also includes a link to a digital version w
Subjects:
Grades:
8th - 11th
Types:
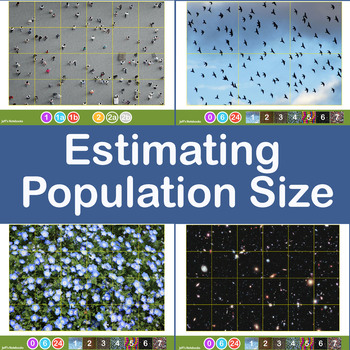
Estimating Crowd and Population Size using Jacob's Method
This investigation delves into estimating the size of a large population of objects by taking a sample and applying some basic mathematics. It encourages sharing of data, refining methods of collection of the data and discussion about the accuracy and limitations of the method used.Jacob's Method of counting large numbers of objects is simple. Draw a grid dividing the area covered into equal size squares. Estimate (by counting) the population of one grid then multiply this by the number of squar
Subjects:
Grades:
6th - 11th, Higher Education, Adult Education
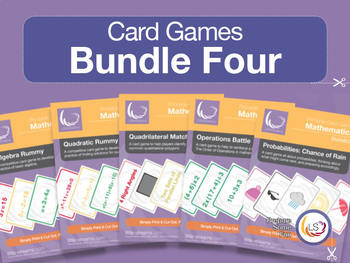
Algebra, Probability, Quadrilaterals - Card Game Bundle 4
This pack contains FIVE different printable card games at discount. High quality, professionally designed pages of learning material put together by a successful Home Tutor and professional graphic designer.The pack contains the following games:• Algebra Rummy | card game for the learning of basic algebra• Quadratic Rummy | advanced card game for the learning of quadratics• Quadrilateral Match | card game for the identification of quadrilaterals and their properties• Operations Battle | card gam
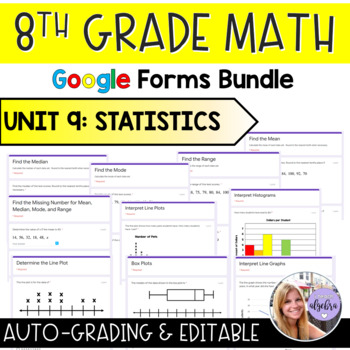
Grade 8 Math Google Forms - Unit 9: Statistics
This is a collection of Google Forms designed to be used through the Google Classroom platform. These forms are perfect for in-class practice, homework assignments, or even as mini quizzes!All of the Google Forms are currently set to be:auto-gradedshow progressallow one answershow results when submittedbut all of these features can of course be adjusted and set to your needs. You can also always edit, remove, or add any problems.Unit 9: Statistics:Interpret Line Plots (10 short answer)Determi
Subjects:
Grades:
6th - 9th
Also included in: Grade 8 Math Google Forms - Bundle for the Entire School Year
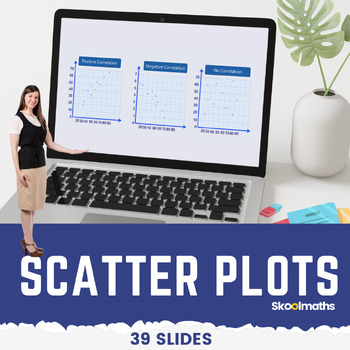
Eight Grade Scatter Plots Digital Math Lesson and Activities CCSS 8.SP.A.1
Eight Grade Scatter Plots Digital Math Lesson and ActivitiesTeach your high school grade how to use and interpret scatter graphs; recognize correlation; draw and use lines of best fit to make predictions?In this lesson, learners will be able to:use and interpret scatter graphs of bivariate data;recognize different types of correlation;draw estimated lines of best fit; anduse lines of best fit to make predictions.
Subjects:
Grades:
8th - 10th, Staff
Types:
CCSS:
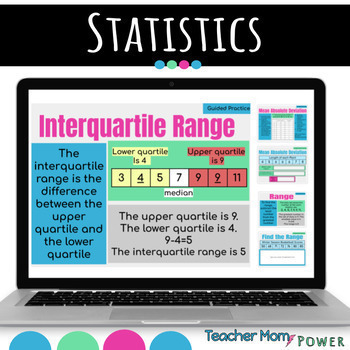
Statistics Digital Unit: Math Stats Lesson & Activities {Google Slides}
Digital Statistics UnitThis Digital Resource can be used as-Google SlidesGoogle Classroom AssignmentAdd to Google DriveUse a PowerPointAssign via other digital meansUsage Suggestions and IdeasThis resource can be utilized in numerous ways, here are some ideas:use for guided practiceassign as partner workassign as independent practicecan be used for morning workuse for reteaching in small group settinguse as review prior to assessmentuse as review in continuing to strengthen skillassign for homew
Subjects:
Grades:
4th - 9th
Types:
Percentage Guide with 30 Printable Activities
This 152 page book is all about percentages (No shock there). It is divided into two parts: Percentage Guide and Printable Percentage Puzzles/Games/Activities.The Guide portion of the book has notes and examples of different situations involving percentages. There is a premium on using an algebraic approach to solving problems in this guide, but different methods are also used. The following are the sections of this guide:Percentage HIstoryPercentage, Fraction, & Decimal ConversionModeling P
Subjects:
Grades:
5th - 12th, Adult Education
Types:
Mean, Median, Mode, and Range Hexagons - Integer Bundle - $ Saving Bundle
Mean, Median, Mode, and Range Hexagons - Integer Bundle
This is a FUN and popular way to review mean, median, mode, and range.
This bundle includes all four of the Hexagon review sheets (including answer keys).
Product Description:
This is fun, easy to grade, partner activity for reviewing mean, median, mode, and range. It takes my students roughly 20 minutes to complete and is ideal for class work or a sub plans.
I encourage students to work in pairs. They work each problem box together, th
Subjects:
Grades:
5th - 10th
Types:
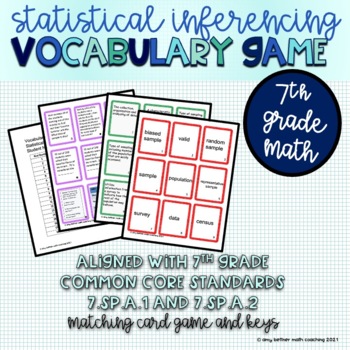
Statistical Vocabulary Matching Game - Random Sampling and Data Collection
Statistics vocabulary can be so hard for students to remember! Understanding the difference between random sampling, systematic random sampling, and biased sampling are among the statistics vocabulary words your student will practice with this activity! This activity contains a memory/matching game utilizing 18 words that students struggle with while learning random sampling methods and what is data collection in Statistics Units in Middle Grades Math. Words such as random sampling, population
Subjects:
Grades:
7th - 9th
Types:
Also included in: Sampling and Statistics Vocabulary Games Bundle
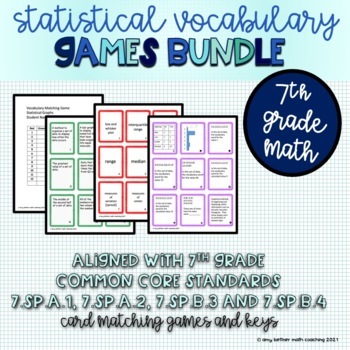
Sampling and Statistics Vocabulary Games Bundle
Statistics vocabulary can be so hard for students to remember! Understanding the difference between random sampling, systematic random sampling, and biased sampling, are among the statistics vocabulary words your student will practice with these activities! This BUNDLE contains 2 memory/matching game utilizing vocabulary that students struggle with while learning statistics vocabulary in 7th grade. Words such as inferencing, biased sample, random, sample, population, mean, median, skewed left, b
Subjects:
Grades:
7th - 9th
Types:
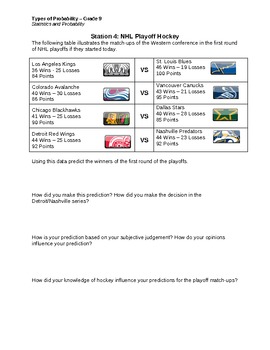
Exploring Probability - Hands on Station Activities
This file has students exploring different kinds of probability (experimental, theoretical, and subjective judgement). The stations allow students to work in hands on situations, and reflect on their learning. I have used this activity with much success - the students enjoyed that it was hands on and included examples related to the NHL and popular contests.
Subjects:
Grades:
6th - 12th
Types:
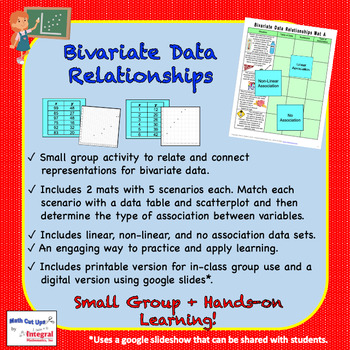
Bivariate Data Relationships
In this hands-on activity, students work in a small group to match a table that represents the bivariate data in 10 real-world scenarios, along with a scatterplot. They then identify the type of association represented by the data (positive, negative, or no association.)This activity also includes a link to a digital version with your purchase. Use this digital option for distance learning needs, to keep absent students engaged with the class activities, or in combination with the print material
Subjects:
Grades:
8th - 11th
Types:
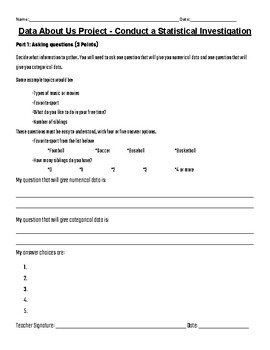
Data Project - Conducting a Statistical Analysis
This data project was created to use at the end of the Connected Math Unit "Data About Us" but it can be used at the culmination of any 5th, 6th, or 7th-grade data unit. It can also be used at any grade level as an enrichment activity or to review statistical data.
Showing 1-24 of 49 results


